[Preprint]. 2025 Jun 1:2025.05.28.656710.
doi: 10.1101/2025.05.28.656710.

Global epistasis in budding yeast driven by many natural variants whose effects scale with fitness

Affiliations

Global epistasis in budding yeast driven by many natural variants whose effects scale with fitness

Ilan Goldstein et al. bioRxiv. .

Update in

Abstract

Global epistasis is a phenomenon in which the effects of genetic perturbations depend on the fitness of the individuals in which they occur. In populations with natural genetic variation, global epistasis arises from interactions between perturbations and polymorphic loci that are mediated by fitness. To investigate the prevalence and characteristics of loci involved in these interactions in the budding yeast Saccharomyces cerevisiae, we used combinatorial DNA barcode sequencing to measure the fitness of 169 cross progeny (segregants) subjected to 8,126 CRISPRi perturbations across two environments. Global epistasis was evident in these data, with more fit segregants within each environment exhibiting greater sensitivity to genetic perturbations than less fit segregants. We dissected the genetic basis of this global epistasis by scanning the genome for loci whose effects covary with CRISPRi-induced reductions in population fitness. This approach identified 58 loci that interact with fitness, most of which exhibited larger effects in the absence of genetic perturbations. In aggregate, these loci explained the observed global epistasis in each environment and demonstrated that the loci contributing to global epistasis largely overlap with those influencing fitness in unperturbed conditions.

Keywords: background effects; fitness; genetic interactions; genetic perturbations; global epistasis; natural genetic variation.


Conflict of interest statement

Conflict of Interest: None declared.

Figures
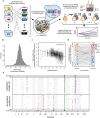
Figure 1.
Figure 1.. Analysis of CRISPRi perturbations in a panel of 169 yeast segregants across two environments.
a) 926,939 unique doubled barcoded lineages, representing distinct segregant-gRNA combinations, were pooled into a single T0 flask. In this paper, we performed a new fitness assay in respiratory media and also reanalyzed prior data from a fitness assay in fermentative media (Hale et al. 2024). In each metabolic environment, we examined two flasks, one in which gRNAs were induced and one in which they were not. The relative fitness of each lineage within a flask was inferred from double-barcode amplicon sequencing data at multipletime points. b) For each gRNA exhibiting a background effect in an environment, we estimated the deviation of the gRNA’s effect in each segregant from its mean effect across all segregants. The broad-sense heritability (H2) of deviation values was calculated for all gRNAs with background effects in respiratory media (mean = 0.58, sd = 0.1). c) A mean deviation value for each segregant in the respiratory environment was computed by averaging all deviation values for that segregant. The relationship between baseline fitness and mean deviation values is shown (n = 169, R2 = 0.45, 95% bootstrap confidence interval = 0.35 – 0.57). Dots represent mean deviation values for individual segregants, with vertical lines indicating two standard deviations. This same plot for fermentative media is shown in (Hale et al. 2024). d) The relationship between baseline segregant fitness and mean deviation values within and between conditions is depicted. Each pair of connected dots represents a single segregant. Dot colors indicate the mean deviation value observed for a segregant in a given environment. The y-axis reflects baseline fitness rank within an environment, whilethe x-axis denotes the environment. e) Visualization of all confidence intervals for loci that show significant interactions with gRNAs, which were identified by linkage mapping. We define the confidence intervals as 2 × −log10 (p-value) of a locus, using the p-value of the most significant SNP at a locus. Hubs for each environment are represented by bars in the rows at the top and bottom of the plot. Stars above and below mark loci detected that influence fitness in the control assays in respiratory and fermentative environments, respectively.
Figure 2.
Figure 2.. A locus whose effect covaries with mean panel fitness.
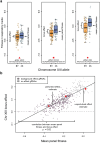
In this figure, we focus on the Chromosome XIII hub in respiratory media as an example for all hubs and other loci detected by our new genetic mapping strategy. a) The three plots show the fitness of all segregants in the presence of three gRNAs with different effects on mean panel fitness. In each plot, segregants are grouped by their allele of the Chr XIII hub, with orange and blue indicating BY and 3 S, respectively. We visualizethe locus effect, which is the difference between the mean fitness of segregants carrying the 3S allele and the mean fitness of the segregants carrying the BY allele. Mean panel fitness, which is calculated as the mean fitness of all segregants in the presence of a given gRNA, is denoted with an arrow. Two gRNAs with significant background effects and one gRNA with no detected effect are shown. The boxplot central lines represent the median, while the box itself spans the interquartile range. Whiskers extend to the most extreme data points within 1.5 times the interquartile range. b) We show a linear relationship between locus effect and mean panel fitness. Each dot represents the locus effect measured among segregants when a particular gRNA is present. We include both gRNAs with background effects, as well as a proportional number of gRNAs that did not show significant effects. Spearman correlations were measured using only the gRNAs with background effects. However, when linear regression was used to estimate locus effects, no effect gRNAs were included to ensure the full range of mean panel fitness was represented in our models.
Figure 3.
Figure 3.. Genome-wide scans for loci that interact with fitness.
a,b) Spearman correlations between locus effects and mean panel fitness at individual SNPs are shown as gray dots. Colored lines represent the mean correlations within 50- SNP windows. Panels (a) and (b) show results for respiratory and fermentative media, respectively. Significant loci within each environment are denoted by red dots above, with the significance threshold indicated by dashed horizontal lines. Hubs detected in each environment are indicated by bars at the bottom of each plot. c,d) Histograms showing the variance in fitness collectively explained by all detected loci for each gRNA exhibiting a background effect (R2). e,f) Histograms displaying the proportion of broad-sense heritability explained by all detected loci for each gRNA (R2/H2).
Figure 4.
Figure 4.. Characteristics of loci that interact with fitness.
a,b) Visualization of linear regressions used to estimate locus effects for a given mean panel fitness. Each point represents a gRNA included in the regression with colored points indicating gRNAs with detected background effects and grey points indicating ‘no-effect’ gRNAs. Black arrow points visualize the ‘unperturbed’ locus effect estimate (defined as mean panel fitness equal to 0), while the base of each arrow represents the ‘perturbed’ locus effect estimate (defined as the 25th percentile mean panel fitness for gRNAs with background effects). The two strongest correlations in respiratory conditions are shown representing loci on Chromosomes XIII (a) and XV (b). c,d) The effects of detected loci in both unperturbed (arrow base) and perturbed conditions (arrow points) in respiratory (c) and fermentative media (d). Hubs are marked with symbols at the base of the arrows. The red square indicates the locus effect estimates for Chromosome XIII visualized in (a), the blue star indicates the locus effect estimates for Chromosome XV visualized in (b), and orange dots indicate all other hubs.
Figure 5.
Figure 5.. Modeling fitness and global epistasis with detected loci.
a,b) Segregant fitness predictions for unperturbed and perturbed conditions were generated using fixed-effects linear models that describethe fitness of every segregant–gRNA combination in an environment as a function of segregant identity, the mean panel fitness resulting from a gRNA, and the interaction between thesetwo factors (segregant-centric models). Results for respiratory and fermentative media are shown in (a) and (b), respectively. c,d) Segregant fitness predictions for unperturbed and perturbed conditions were generated using fixed-effects linear models that describe the fitness of segregant-gRNA combinations as a function of a segregant’s genotype at each of the detected loci, the mean panel fitness resulting from a given gRNA, and all possible two-way interactions between loci and mean panel fitness (multi-locus models). Results for respiratory and fermentative media are presented in (c) and (d), respectively. In (a) through (d), each segregant is represented by an unperturbed value (black circles) and a perturbed value (gray circles), and the pair of values from the same segregant are connected by a blue line. e,f) Comparison of segregant fitness predictions for unperturbed and perturbed conditions from the segregant-centric and multi-locus models in respiratory (e) and fermentative (f) media. Horizontal and vertical lines represent 95% bootstrap confidence intervals for each segregant in the respective models. Black and gray indicate unperturbed and perturbed conditions, respectively.

Similar articles

References

    1. Ardell SM, Martsul A, Johnson MS, Kryazhimskiy S. 2024. Environment-independent distribution of mutational effects emerges from microscopic epistasis. Science. 386(6717):87–92. doi: 10.1126/science.adn0753. - DOI - PMC - PubMed
    1. Bachmann M. 2024. rapidfuzz/RapidFuzz: Release 3.8.1. doi: 10.5281/zenodo.10938887. [accessed 2025 Jan 25]. https://zenodo.org/records/10938887. - DOI
    1. Barter R, Yu B. 2017. superheat: A Graphical Tool for Exploring Complex Datasets Using Heatmaps. [accessed 2025 Jan 25]. https://cran.r-project.org/web/packages/superheat/index.html.
    1. Bloom JS, Ehrenreich IM, Loo WT, Lite T-LV, Kruglyak L. 2013. Finding the sources of missing heritability in a yeast cross. Nature. 494(7436):234–237. doi: 10.1038/nature11867. - DOI - PMC - PubMed
    1. Boyle EA, Li YI, Pritchard JK. 2017. An Expanded View of Complex Traits: From Polygenic to Omnigenic. Cell. 169(7):1177–1186. doi: 10.1016/j.cell.2017.05.038. - DOI - PMC - PubMed

Publication types

LinkOut - more resources