[Preprint]. 2025 Jun 6:2025.01.09.632095.
doi: 10.1101/2025.01.09.632095.

c-Myc inhibits macrophage antimycobacterial response in Mycobacterium tuberculosis infection

Affiliations

c-Myc inhibits macrophage antimycobacterial response in Mycobacterium tuberculosis infection

Edoardo Sarti et al. bioRxiv. .

Update in

Abstract

Mycobacterium tuberculosis (MTB) is a major global cause of mortality worldwide, responsible for over a million deaths annually. Despite this burden, natural immunity prevents disease in more than 90% of exposed individuals. Previous studies have identified interferon-gamma (IFN-γ) as a key regulator of innate immune defense against MTB. Here, we investigate the impact of IFN-γ timing on macrophage-mediated control of MTB infection. We demonstrate that IFN-γ exposure before infection enhances macrophage antibacterial activity, whereas post-infection exposure does not. Further investigation into this phenotype revealed a strong association between c-Myc signaling and macrophage function in MTB control, as identified using unbiased in vitro systems approaches. Given the challenge of perturbing c-Myc in primary cells, we developed a lentiviral system for c-Myc inhibition and overexpression. Using a tetracycline-inducible Omomyc system - a small peptide inhibitor of c-Myc - we show that c-Myc inhibition promotes a pro-inflammatory macrophage phenotype with enhanced antimycobacterial activity. Mechanistically, c-Myc inhibition induces metabolic reprogramming via increased mTORC1 activity, leading to upregulated inducible nitric oxide synthase and improved bacterial control. In vivo analyses, including murine models and human clinical histopathology, reveal a strong correlation between c-Myc expression and MTB persistence, as well as active tuberculosis (TB), suggesting a role for c-Myc in immune evasion. These findings reveal c-Myc as a potential mediator of immune privilege in MTB infection and highlight its role as a promising target for novel TB therapies aimed at enhancing macrophage function.


Figures

Figure 1.
Figure 1.. Antimycobacterial properties of IFN-γ depend on the sequence of infection and IFN-γ exposure
A) Experimental workflow. BMDMs were isolated from C57BL/6 mice and differentiated for 6 days. Cells were either pre-activated with IFN-γ (25 ng/mL) 24 h before infection or treated immediately after infection. Infection was performed with MTB H37Rv (MOI 5). B) Kinetics of intracellular bacterial burden. CFU/mL of intracellular MTB H37Rv were measured immediately after phagocytosis (day 0) and at days 3 and 5 post-infection. Data are mean ± SD of five independent experiments, normalized to day 0. C) A representative flow cytometry plot showing viable F4/80⁺CD11b⁺ BMDMs infected with MTB H37Rv live-dead strain is shown. Infected (mCherry⁺) cells are subdivided into “permissive” or “restrictive” populations based on GFP induction (1 μg/mL doxycycline) after 24 h. D) Percentage of “permissive” macrophages (GFP⁺) at days 0, 3 and 5 post-infection. E–F) Activation marker expression. Median fluorescence intensity (MFI) of MHC-II (E) and CD86 (F) in infected BMDMs at days 0, 3 and 5, with representative plots (full-treatment condition shown). Unless otherwise stated, data are mean ± SD (n = 3). Statistical analysis: P values were determined by unpaired two-tailed Student’s t-test (before vs. after infection) and corrected for multiple testing using the two-stage linear step-up method of Benjamini–Krieger–Yekutieli.
Figure 2:
Figure 2:. Changes in c-Myc associated transcriptional programs mirror MTB permissive versus controlling macrophages in vitro
A) Principal component analysis (PCA) of differently activated/infected BMDMs, 6 and 24 h after infection with MTB H37Rv (MOI 5). Each point represents an individual sample, with colors indicating the treatment. PC1 and PC2 are plotted with the percent variance explained indicated. B) Volcano plot of differential expression in BMDMs 24 h post-infection, comparing IFN-γ after vs. IFN-γ before conditions. Genes are plotted by log2 fold-change (x-axis) against –log10(adjusted P) (y-axis). Red dots mark genes meeting |log2FC| > 2 and adjusted P < 0.01; dashed lines denote these thresholds. C) Gene set enrichment analysis (GSEA) dot plot of Hallmark pathways from BMDMs 24 h post-infection, comparing IFN-γ administered before infection versus IFN-γ added after infection. Dots represent normalized enrichment scores (adjusted P < 0.05), with positive values indicating enrichment in the before condition. NES values were computed by fgsea on MSigDB Hallmarks (v2024.1.Mm). D) Connected-dot plot of GSEA comparing IFN-γ–activated BMDMs before and after relative to untreated, uninfected controls. Each point represents one gene set’s NES: orange circles mark sets significantly enriched in the before vs. control comparison (adjusted P < 0.05), blue circles mark sets significantly enriched in the after vs. control comparison (adjusted P < 0.05). The y-axis shows NES values (positive = up-regulation; negative = down-regulation). Gray dashed lines connect the same gene set’s NES across the two contrasts; the solid black line highlights those gene sets that reverse their direction of regulation between pre- and post-infection. E) Heatmap of leading-edge genes (top 40 genes) of the MYC_TARGETS_V1 set across all four conditions 24 h after infection. The differential expression is calculated as mean log2 fold-change per condition compared to untreated, uninfected BMDMs (n = 3). All data shown were derived from bulk RNA sequencing.
Figure 3:
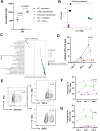
Figure 3:. c-Myc inhibition leads to a gain in anti-mycobacterial function and induces a pro-inflammatory phenotype in macrophages in vitro
A) RNA expression of rtTa-NGFR (transduction marker) was measured by bulk RNA sequencing as transcripts per million (TPM) in transduced BMDMs after 24 h (n = 3). B) Principal component analysis (PCA) of BMDMs expressing either c-Myc or Omomyc versus WT 24 h after Tet-on induction with doxycycline (100ng/mL). Each point represents an individual sample, with colors indicating the experimental group. PC1 and PC2 are plotted with the percent variance explained on the axes. C) Gene set enrichment analysis (GSEA) dot plot of Hallmark pathways from BMDMs expressing Omomyc compared to BMDMs expressing c-Myc 24 h after Tet-on induction with doxycycline. Dots represent normalized enrichment scores (adjusted P < 0.01), with positive values indicating enrichment in the Omomyc group. NES values were computed by fgsea on MSigDB Hallmarks (v2024.1.Mm). D) Kinetics of intracellular bacterial burden in WT BMDMs, BMDMs treated with the chemical c-Myc inhibitor 10058-F4, and BMDMs expressing c-Myc or Omomyc. CFU/mL of intracellular MTB H37Rv were measured immediately after phagocytosis (day 0) and at days 3 and 5 post-infection. Data are mean ± SD of three independent experiments, normalized to day 0. E) Representative flow cytometry plots of fully mature BMDMs infected with mCherry-expressing MTB, gated on mCherry⁺ cells, showing intracellular TNF-α and iNOS expression (Omomyc-transduced condition is shown). F–G) Quantification of the proportion of mCherry⁺ BMDMs expressing (F) TNF-α and (G) iNOS at days 0, 3 and 5 post-infection. WT BMDMs, WT pre-treated with IFN-γ, and BMDMs expressing c-Myc or Omomyc were infected and analyzed by flow cytometry. Data are mean ± SD of three independent experiments. Statistical analysis: P values were determined by unpaired two-tailed Student’s t-test (Omomyc transduced vs. WT untreated) and corrected for multiple testing using the two-stage linear step-up method of Benjamini–Krieger–Yekutieli.
Figure 4:
Figure 4:. c-Myc inhibition associated gain of antimycobacterial function is partly mediated by a shift towards mTORC1 signaling
A) Bar plot of Hallmark metabolic pathways significantly enriched by gene set enrichment analysis (GSEA) (adjusted P < 0.01). Bars show normalized enrichment scores (NES), positive NES (red bars) denote enrichment in the Omomyc group. B) Heatmap of leading-edge genes from the MTORC1_SIGNALING Hallmark pathway. Rows are genes contributing most to the enrichment score, columns are individual Omomyc-expressing or WT BMDM samples. Values are log2 fold-change relative to the average of WT samples. C) Representative flow cytometry plots showing the proportion of iNOS⁺ cells in mCherry⁺ BMDMs on day 3 after infection with mCherry-expressing MTB (MOI 5). WT cells, Omomyc-expressing cells and Omomyc-expressing cells treated with 10 μM rapamycin are displayed. All samples received 0.1% DMSO. D) Proportion of infected (mCherry⁺) BMDMs expressing iNOS at days 0, 3 and 5 post-infection in WT, Omomyc-expressing, Omomyc-expressing + rapamycin, and WT + IFN-γ conditions. Data are mean ± SD (n = 3). E) Kinetics of intracellular bacterial burden. CFU/mL of MTB H37Rv were measured in WT BMDMs, Omomyc-expressing BMDMs, Omomyc-expressing + rapamycin, and WT + IFN-γ BMDMs immediately after phagocytosis (day 0) and at days 3 and 5 post-infection. Data represent mean relative changes (range) ± SD from three independent experiments, normalized to day 0. Statistical analysis: P values were determined by unpaired two-tailed Student’s t-test (Omomyc transduced vs. Omomyc transduced + rapamycin) and corrected for multiple testing using the two-stage linear step-up method of Benjamini–Krieger–Yekutieli.
Figure 5:
Figure 5:. c-Myc expression is associated with MTB infection in the contained MTB infection (CMTB) mouse model of tuberculosis and in the pulmonary infection model
A) Lymph nodes from control and CMTB mice were depleted of CD3⁺/CD20⁺ cells and subjected to scRNA-seq. Major clusters were annotated by ImmGen matching, with the monocyte/macrophage cluster circled. B) UMAP of the circled monocyte/macrophage cluster showing clear segregation of infected versus non-infected cells. C) Single-cell c-Myc gene scores in infected versus control cells, calculated using AddModuleScore (aggregated expression of control gene set subtracted). D) Representative immunohistochemistry pathology slides (previously published) from mice with and without CMTB and stained with an anti c-Myc antibody. Lesion size and number of c-Myc-expressing cells were analyzed using a semiautomated pipeline. F) Boxplot showing the density of c-Myc-expressing cells measured as number c-Myc positive cells by lesion area (million pixels) in CMTB mice compared to control. G) Correlation between number of c-Myc-expressing cells in a lesion and area of the lesion, in CMTB mice and in control mice. Data were analyzed using a two-tailed Student’s t-test.
Figure 6:
Figure 6:. c-Myc expression is associated with the immune privileged niche in the human granuloma during active TB
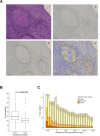
A) Immunohistochemical stain for c-Myc (i-ii) in inner or outer granuloma. Inner and outer granulomas were manually segmented (iii) followed by automatic nuclei detection and classification of mean c-Myc staining intensity into negative (blue) or positive: weak (yellow), moderate (orange), or strong (red) (iv). B) Boxplot showing percent of c-Myc -positive nuclei in granuloma regions; inner granulomas had a higher mean percentage of nuclei positive for c-Myc staining (32.3%) compared to outer granulomas (23.1%). The horizontal grey line shows the percentage of positive nuclei outside granulomas (17.1%). C) Individual nuclei were grouped by distance to the rim of the nearest inner granuloma into 100 μm bins and the percentages of nuclei with positive staining by intensity were calculated; negative distances indicate the nucleus is within the inner granuloma. The total number of nuclei within each bin is represented at the top. Data were analyzed using a two-tailed Student’s t-test.

References

    1. WHO. Global Tuberculosis Report. Geneva, Switzerland: World Health Organization. (2024).
    1. Flynn J. L. & Chan J. Immune cell interactions in tuberculosis. Cell 185, 4682–4702 (2022). - PMC - PubMed
    1. Cohen S. B., Gern B. H. & Urdahl K. B. The Tuberculous Granuloma and Preexisting Immunity. Annu Rev Immunol 40, 589–614 (2022). - PubMed
    1. Lin P. L. et al. Sterilization of granulomas is common in active and latent tuberculosis despite within-host variability in bacterial killing. Nat Med 20, 75–79 (2014). - PMC - PubMed
    1. Cadena A. M., Fortune S. M. & Flynn J. L. Heterogeneity in tuberculosis. Nat Rev Immunol 17, 691–702 (2017). - PMC - PubMed

Publication types

LinkOut - more resources