[Preprint]. 2025 May 28:2025.05.23.655671.
doi: 10.1101/2025.05.23.655671.

Nuclear Phase Separation Drives NPM1-mutant Acute Myeloid Leukemia

Affiliations

Nuclear Phase Separation Drives NPM1-mutant Acute Myeloid Leukemia

Gandhar K Datar et al. bioRxiv. .

Abstract

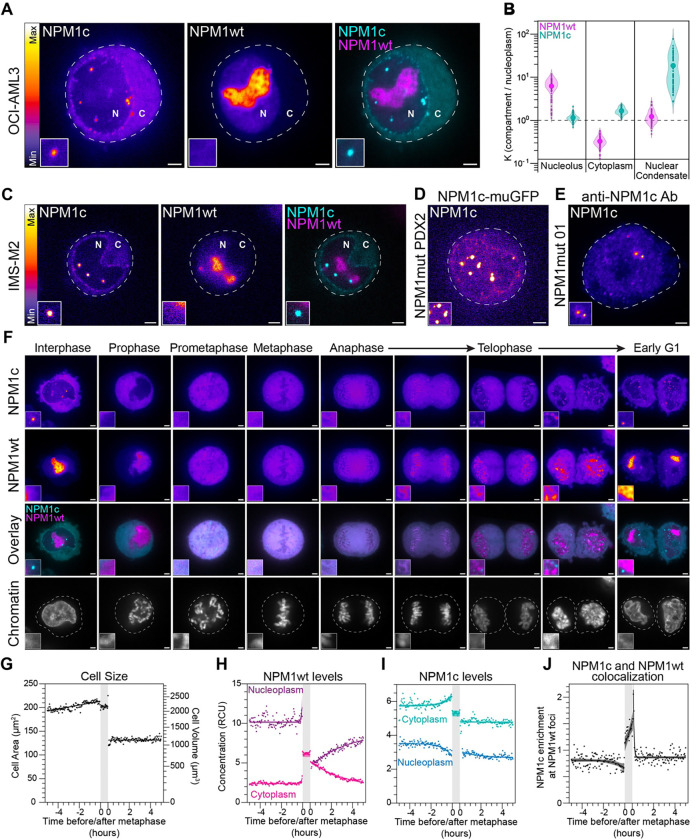
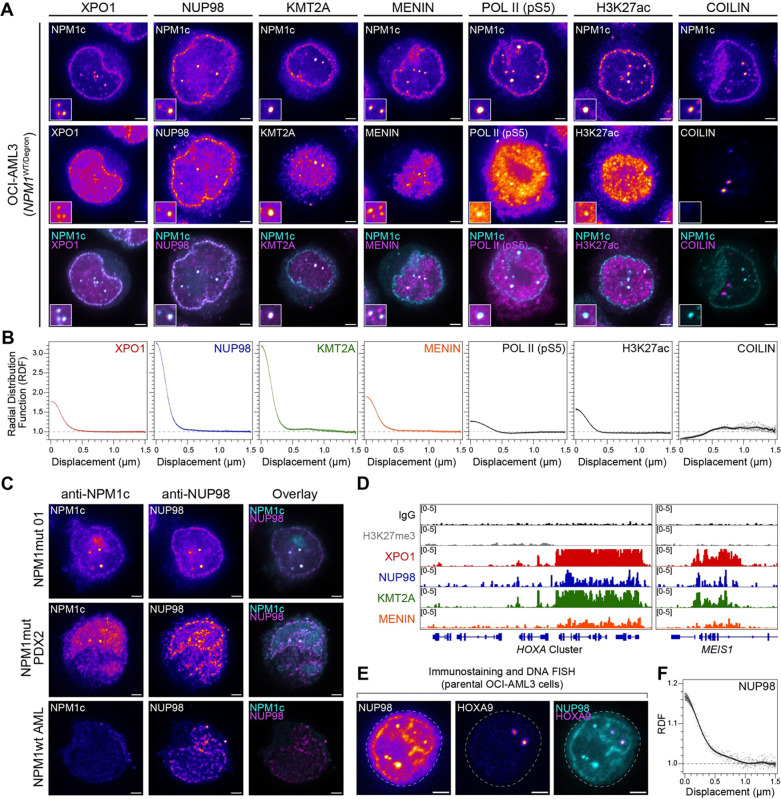
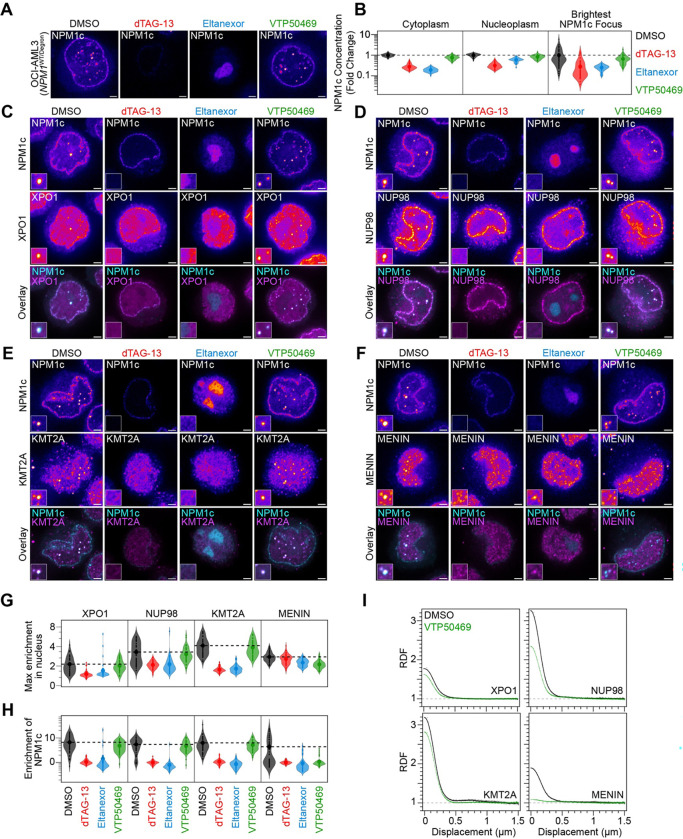
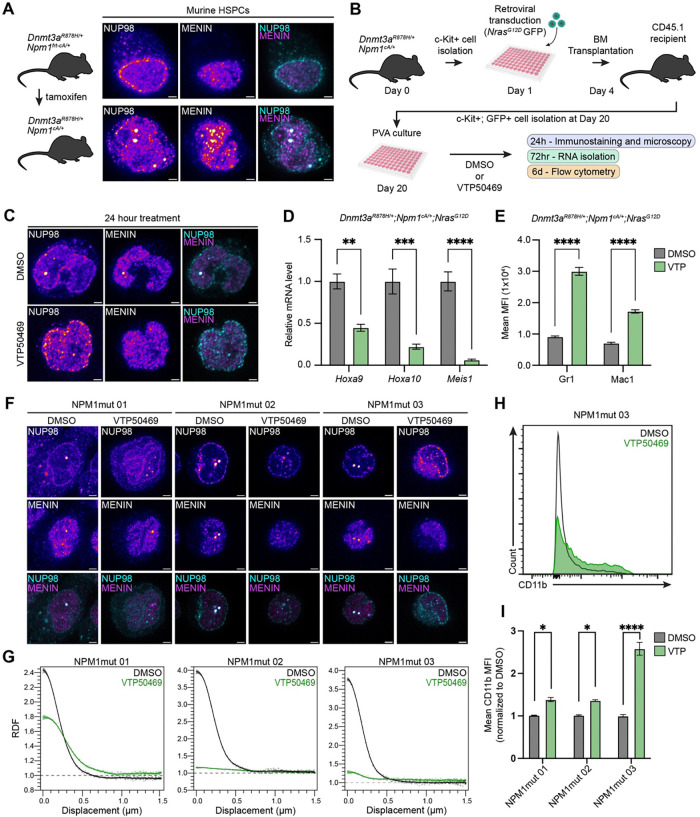
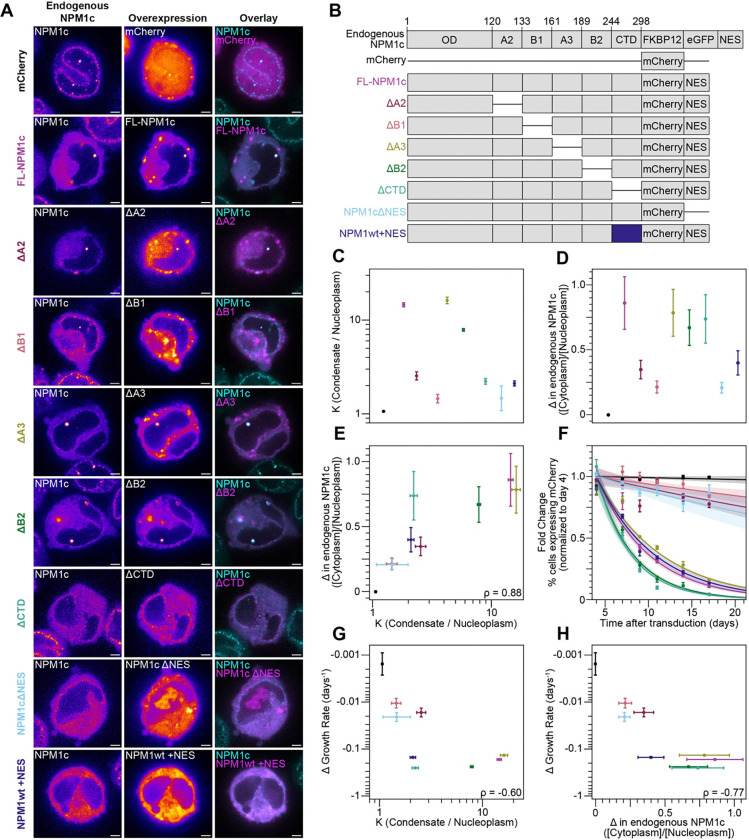
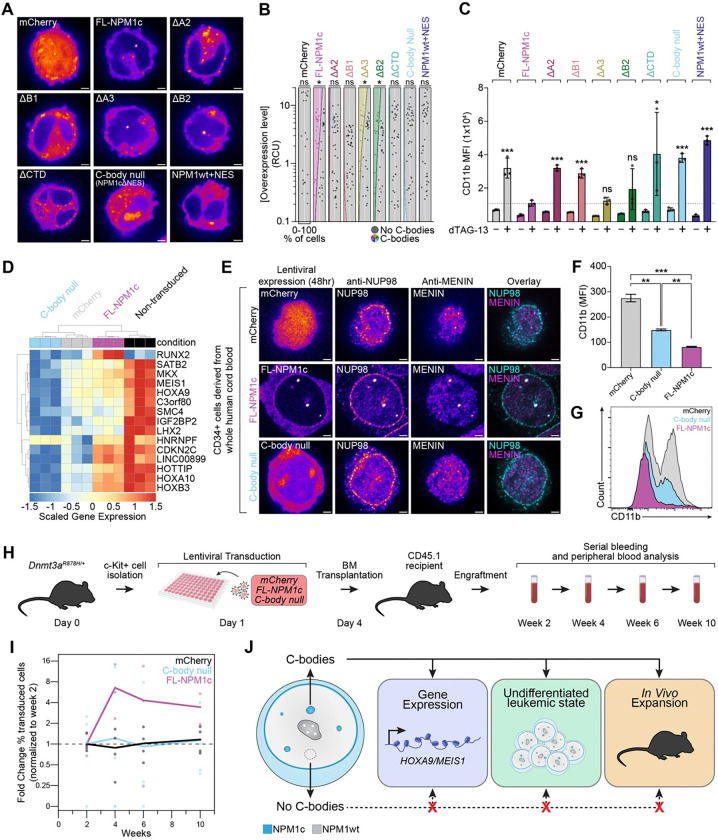
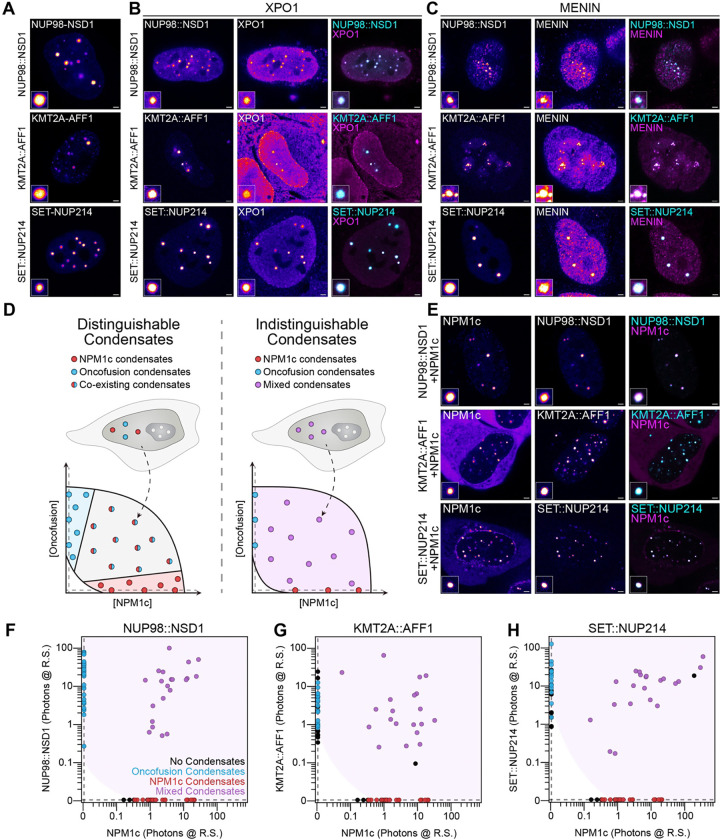
During cancer development, mutations promote gene expression changes that cause transformation. Leukemia is frequently associated with aberrant HOXA expression driven by translocations in nucleoporin genes or KMT2A, and mutations in NPM1. How disparate mutations converge on this regulatory pathway is not understood. Here we demonstrate that mutant NPM1 (NPM1c) forms nuclear condensates in multiple human cell lines, mouse models, and primary patient samples. We show NPM1c phase separation is necessary and sufficient to coordinate the recruitment of NUP98 and KMT2A to condensates. Through extensive mutagenesis and pharmacological destabilization of phase separation, we find that NPM1c condensates are necessary for regulating gene expression, promoting in vivo expansion, and maintaining the undifferentiated leukemic state. Finally, we show that nucleoporin and KMT2A fusion proteins form condensates that are biophysically indistinguishable from NPM1c condensates. Together, these data define a new condensate underlying leukemias that we term coordinating bodies (C-bodies), and propose C-bodies as a therapeutic vulnerability.


Figures

Figure 1:
Figure 1:. NPM1c resides in nuclear condensates that are established during cell division.
(A) Live cell imaging of CRISPR-edited OCI-AML3 cells containing endogenous C-terminal-tagged NPM1c and NPM1wt (muGFP and mCherry respectively). (B) Quantification of partition coefficients (K) for NPM1wt (magenta) and NPM1c (cyan) within listed compartments relative to nucleoplasm (n = 100). (C) Live cell imaging of IMS-M2 cells with dual labeling as in panel A. (D) Live cell imaging of CRISPR-edited NPM1-mutant patient-derived xenograft (PDX2) cells with labeled NPM1c as in panel A. The window of minimum/maximum pixel intensities for this image was adjusted to optimally visualize condensates and the cytoplasm. (E) Immunostaining of primary NPM1-mutant AML patient sample (NPM1mut 01) with anti-NPM1c antibody. (F) Live cell imaging of dual-labeled OCI-AML3 cells stained with SPY650-DNA, a chromatin-labeling dye. Representative images of cell cycle stages are shown. (G-K) Quantification of live-cell imaging data of dual-labeled OCI-AML3 imaged every 3 minutes for ~10hrs (n = 10). Metaphase (shaded gray) is defined by the average time between the earliest visualization of prometaphase and anaphase. (G) Quantification of cell area (μm2) and approximate volume (μm3). (H) NPM1wt and (I) NPM1c concentration in photons in relative concentration units (RCU). Timepoints reflecting prometaphase through anaphase have been annotated as cytoplasm. (J) Quantification of NPM1c enrichment in regions with high NPM1wt abundance. The brightest region (0.15μm2 box) of each cell containing NPM1wt was identified in individual cells and NPM1c level was measured. All images are shown in Fire LUT (see color scales in panels A & C) except for colocalization (cyan and magenta) and chromatin (grayscale). Dashed lines outline cytoplasmic membranes. N = nucleus. C = cytoplasm. White scale bars = 2μm. All insets are magnified 2μm square regions.
Figure 2:
Figure 2:. NPM1c condensates recruit chromatin regulatory proteins essential for leukemia
(A) Immunostaining of OCI-AML3 cells with GFP-tagged NPM1c (NPM1WT/Degron) for XPO1, NUP98, KMT2A, MENIN, and COILIN in fixed cells. (B) Radial distribution function (RDF) of antibody staining centered around the brightest nuclear NPM1c condensate per cell (n = 50 cells per staining). (C) Immunostaining of NPM1-mutant and wild-type NPM1 primary AML patient samples, and a PDX model of NPM1-mutant AML using anti-NPM1c and anti-NUP98 antibodies. (D) CUT&RUN sequencing data from NPM1WT/Degron OCI-AML3 cells measuring chromatin-enrichment of XPO1, NUP98, KMT2A, and MENIN at relevant genetic loci (1 replicate of HOXA gene cluster and MEIS1 locus shown here, n = 2 replicates per antibody). IgG and H3K27me3 are displayed as negative and positive controls, respectively. All images are shown in Fire LUT except colocalization (cyan and magenta). (E) Combined immunostaining and DNA FISH of OCI-AML3 cells using anti-NUP98 (cyan) antibodies and HOXA9-specific probes (magenta). (F) RDF of NUP98 antibody staining centered around HOXA9 loci (n = 68 loci). White scale bars = 2μm. All insets are magnified 2μm square regions.
Figure 3:
Figure 3:. NPM1c condensates are necessary for protein recruitment
(A) Live cell imaging of NPM1WT/Degron OCI-AML3 cells treated with DMSO, dTAG-13, Eltanexor, or VTP50469. (B) Quantification of NPM1c concentration across compartments after drug treatments (n = 50). (C-F) Immunostaining of NPM1WT/Degron OCI-AML3 cells with antibodies targeting XPO1, NUP98, KMT2A, and MENIN after specific drug treatments. (G) Quantification of max protein enrichment in the nucleoplasm (n = 50). (H) Enrichment of NPM1c protein within max enriched ROI (n = 50). (I) RDF of XPO1, NUP98, KMT2A, and MENIN with DMSO or VTP50469 treatment, (n = 50). All cells were treated at same concentrations for 24hrs prior to live cell imaging or immunostaining (dTAG-13 = 500nM, Eltanexor = 100nM, VTP50469 = 300nM). All images are shown in Fire LUT except colocalization (cyan and magenta). White scale bars = 2μm. All insets are magnified 2μm square regions. For image analysis, the brightest region containing NPM1c or other protein in the nucleus is identified (0.15μm2 box) in individual cells and concentration (photons at reference settings) is measured and normalized to untreated controls.
Figure 4:
Figure 4:. Compositional alteration of C-bodies impacts leukemic features in primary murine and human cells.
(A) Npm1c induction with tamoxifen in mice (LEFT) and immunostaining of HSPCs isolated from NPM1frtC and NPM1c donor mice with anti-NUP98 (cyan) and anti-MENIN (magenta) antibodies. (B) Schematic representation of Npm1c AML model development for ex vivo studies. (C) Immunostaining of murine HSPCs treated with DMSO or VTP50469 ex vivo with anti-NUP98 (cyan) and anti-MENIN (magenta) antibodies. (D) Real-time qPCR analysis of Hoxa9, Hoxa10 and Meis1 mRNA levels and (E) flow cytometry analysis of myeloid differentiation markers Gr1 and Mac1 (MFI) in murine HSPCs treated with DMSO or VTP50469 ex vivo. (F) Immunostaining of human AML patient cells treated with DMSO or VTP50469 ex vivo with anti-NUP98 (cyan) and anti-MENIN (magenta) antibodies. (G) RDF of NUP98 and MENIN with DMSO or VTP50469 treatment (n = 20–60 cells per sample). (H) Representative histogram of CD11b fluorescence intensity in DMSO and VTP50469. (I) Fold change of mean CD11b fluorescence level in patient samples relative to DMSO cells. All cells were treated at the same concentrations for 24hrs prior to live cell imaging or immunostaining. Flow cytometry analysis was performed at day 3 and day 6 in human and murine cells respectively.
Figure 5:
Figure 5:. Destabilization of NPM1c condensates is associated with enhanced cytoplasmic export of NPM1c and reduced cell growth.
(A) Live cell imaging of NPM1WT/Degron OCI-AML3 cells (no dTAG treatment) expressing NPM1c truncations. (B) Schematic of NPM1c truncation series. (C) Partitioning (K) of each truncation into nuclear condensates (Condensate/Nucleoplasm). Error bars indicate fit parameter standard error. (D) Instantaneous change (as in Figure 4C) in endogenous NPM1c localization [Cytoplasm/Nucleoplasm] with expression of truncations. Error bars indicate fit parameter standard error. (E) Correlation between partitioning (K) and change in endogenous NPM1c localization. (F) Fold Change of % cells expressing truncations over 17 days (normalized to Day 4), measured by flow cytometry (includes repeated data for FL-NPM1c and mCherry as shown in Figure 4) n = 3 biological replicates per truncation. (G) Correlation of change in growth rate (shown as days−1) with partitioning (K) into C-bodies and (H) change in endogenous NPM1c localization [Cytoplasm/Nucleoplasm]. n > 40 for panels C-E, G, H. ρ is Spearman correlation coefficient. All images are shown in Fire LUT except colocalization (cyan and magenta). White scale bar = 2μm.
Figure 6:
Figure 6:. Multiple domains of NPM1c are required for condensate formation and maintaining the disease state.
(A) Live cell imaging of NPM1WT/Degron OCI-AML3 cells expressing NPM1c truncations after 7 days of dTAG-13 (500nM) treatment. (B) Quantification of NPM1c concentration in photons in relative concentration units (RCU) and condensate formation after dTAG-13 treatment (includes data repeated from Figure 4). Shaded regions represent fraction of cells without condensates (gray), or with condensates (multicolor). Spearman Rank Test, *p<.05, n > 40. (C) Median Fluorescence Intensity (MFI) of CD11b via flow cytometry after 14 days of DMSO or dTAG-13 treatment, n = 3 biological replicates per treatment and truncation. (includes data repeated from Figure 4). Dashed line indicates mean MFI (media fluorescence intensity of each sample) value for FL-NPM1c expression after dTAG-13 treatment. (D) Heatmap and hierarchical clustering of C-body target genes expression in OCI-AML3 cells with NPM1c overexpression. (E) Immunostaining of CD34+ cord blood cells expressing NPM1c with antibodies targeting NUP98 and MENIN. (F) Mean CD11b fluorescence level in CD34+ cord blood cells expressing NPM1c. (G) Representative histogram of CD11b fluorescence intensity of CD34+ cord blood cells expressing FL-NPM1c, C-body null, and mCherry. (H) Schematic depicting NPM1c overexpression in murine HSPCs harboring mutant Dnmt3a. (I) Fold change of donor cells expressing NPM1c in the peripheral blood of mice (n = 3 per group). (J) Schematic depicting the role of C-bodies in human and murine primary cells. All images are shown in Fire LUT except colocalization (cyan and magenta). White scale bars = 2μm. Error bars = mean ± standard deviation. *p <.05, **p <.01, ***p <.001, Z-test.
Figure 7:
Figure 7:. Independent drivers of phase separation converge on C-body formation in leukemia
(A) Live cell imaging of U2OS cells expressing oncofusion proteins. (B) Immunostaining of U2OS cells expressing oncofusion proteins with antibodies targeting XPO1 and (C) MENIN. (D) Schematic representation of the biophysical assay to identify condensate miscibility in cells. Plots depict phase diagrams (based on analytical solutions to Flory-Huggins theory shown in Figure S7) in which co-expression of individual proteins yields co-existing (distinguishable) or mixed (indistinguishable) condensates. Shaded regions indicate distinct phases. Dots indicate NPM1c condensates (red), oncofusion condensates (blue), co-existing condensates (red and blue), or mixed condensates (purple). Points on axes represent cells expressing only one protein and have been shifted (dashed line). (E) Live cell imaging of U2OS cells expressing NPM1c and individual oncofusion proteins. (F-H) Quantification of nucleoplasm in individual cells expressing oncofusions, NPM1c, or both (Photons @ R.S.). Black dots indicate cells without nuclear condensates, and remaining colors are as indicated in (D). Shaded regions highlight approximate phase boundaries. Points on axes represent cells expressing only one protein and have been shifted (dashed line). NPM1c data from x-axes is duplicated and shown in all 3 panels. All images are shown in Fire LUT except colocalization (cyan and magenta). White scale bars = 2μm. All insets are magnified 2μm square regions.

Similar articles

References

    1. Lyon A.S., Peeples W.B., and Rosen M.K. (2021). A framework for understanding the functions of biomolecular condensates across scales. Nat. Rev. Mol. Cell Biol. 22, 215–235. - PMC - PubMed
    1. Grisendi S., Mecucci C., Falini B., and Pandolfi P.P. (7/2006). Nucleophosmin and cancer. Nat. Rev. Cancer 6, 493–505. - PubMed
    1. Mitrea D.M., Cika J.A., Guy C.S., Ban D., Banerjee P.R., Stanley C.B., Nourse A., Deniz A.A., and Kriwacki R.W. (2016). Nucleophosmin integrates within the nucleolus via multi-modal interactions with proteins displaying R-rich linear motifs and rRNA. Elife 5. 10.7554/eLife.13571. - DOI - PMC - PubMed
    1. Lindström M.S. (2011). NPM1/B23: A Multifunctional Chaperone in Ribosome Biogenesis and Chromatin Remodeling. Biochem. Res. Int. 2011, 195209. - PMC - PubMed
    1. Yao Z., Duan S., Hou D., Wang W., Wang G., Liu Y., Wen L., and Wu M. (2010). B23 acts as a nucleolar stress sensor and promotes cell survival through its dynamic interaction with hnRNPU and hnRNPA1. Oncogene 29, 1821–1834. - PubMed

Publication types

LinkOut - more resources