[Preprint]. 2025 Jun 5:2025.03.23.644666.
doi: 10.1101/2025.03.23.644666.

De novo design of miniprotein agonists and antagonists targeting G protein-coupled receptors

Affiliations

De novo design of miniprotein agonists and antagonists targeting G protein-coupled receptors

Edin Muratspahić et al. bioRxiv. .

Abstract

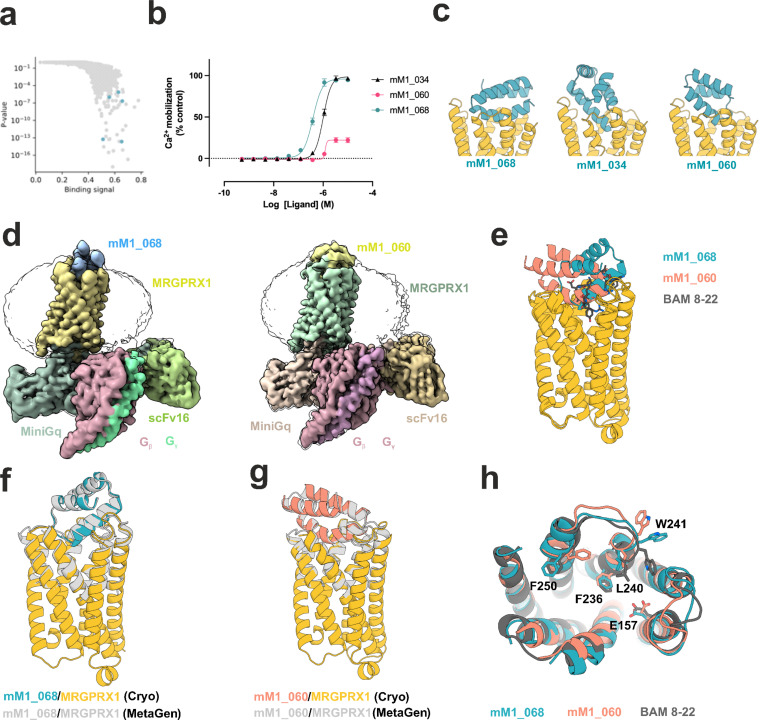
G protein-coupled receptors (GPCRs) play key roles in physiology and are central targets for drug discovery and development, yet the design of protein agonists and antagonists has been challenging as GPCRs are integral membrane proteins and conformationally dynamic. Here we describe computational de novo design methods and a high throughput "receptor diversion" microscopy-based screen for generating GPCR binding miniproteins with high affinity, potency and selectivity, and the use of these methods to generate MRGPRX1 agonists and CXCR4, GLP1R, GIPR, GCGR and CGRPR antagonists. Cryo-electron microscopy data reveals atomic-level agreement between designed and experimentally determined structures for CGRPR-bound antagonists and MRGPRX1-bound agonists, confirming precise conformational control of receptor function. Our de novo design and screening approach opens new frontiers in GPCR drug discovery and development.


Figures

Fig. 1.
Fig. 1.. GPCR binder computational design and screening methods.
a Designed backbones targeting GPCRs of interest were generated either de novo using constrained or scaffold-guided RFdiffusion (bottom), or by docking a library of 7,000 native miniproteins (top). Following sequence assignment and selection of most promising designs based on in silico metrics, class A and class B GPCR binders were screened either directly in functional assays or first by high-throughput binding assays including yeast cell surface display using nanodiscs, biofloating assay or a newly developed Optical Pooled Screening-Receptor Diversion (OPS-RD) assay in mammalian cells in which designed binders retained in the ER retain fluorescently tagged wild-type receptors. Binding is detected by converting binder-receptor interactions to an optical phenotype: in the absence of binding, fluorescently tagged receptors traffic to the cell surface while the design is retained separately in the secretory pathway (b, left), whereas a successful binder colocalizes with the receptor in the secretory pathway (b, right). c Using nanobodies with known affinities targeting a GFP-fused protease-activated receptor 2 (PAR2), the binding signal (GFP-RFP pixel cross-correlation) is proportional with the binding affinity, can be enhanced using oligomerized binding constructs with increased avidity. d The binding phenotype is robust across seven GFP-fused GPCRs, with positive controls (C5-oligomerized 0.7 nM anti-GFP nanobody) showing significantly higher binding signals compared to negative controls (non-binding miniproteins). The fraction of cells with the binding phenotype is computed from ≥80 cells, and SEM is scaled to N = 50 cells (a scale suitable for HTS). e False-positive rate at a fixed false-negative rate (5%) as a function of the number of cells imaged across GPCR targets based on the same controls as d. To deploy OPS-RD at scale, f designed binders are synthesized on oligo arrays and cloned into a lentiviral library, g low multiplicity of infection (MOI) transduction creates a cell library with one binder design per cell, h binding is quantified by receptor trapping, and i in situ sequencing of a DNA barcode reveals the identity of the binder in each cell.
Fig. 2.
Fig. 2.. Pharmacological characterization and cryo-EM structures of MetaGen-designed MRGPRX1 binders.
a 13,000 miniprotein binders were designed as agonist with MetaGen and tested using OPS-RD. The colocalization (binding signal) induced in cells with the same binder was compared to the colocalization distribution across all imaged cells (>2.5 million), and P-values were computed using a Kolmogorov–Smirnov (K-S) test. b Concentration-response curves of three agonist hits measured in a calcium flux assay (n=3). c Computational models of three agonist hits. Receptor structures are truncated for clarity. d Cryo-EM maps of hMRGPRX1 bound to miniprotein mM1_068 (left) and hMRGPRX1 bound to mM1_060 (right). The silhouettes show the map at low threshold to enable visualization of the detergent micelles. e Aligned cryo-EM models of mM1_068, mM1_060, and BAM 8–22 bound to hMRGPRX1. f Alignment of the experimental structure of mM1_068 + hMRGPRX1 complex with the designed model. g Alignment of the experimental structure of mM1_060 + hMRGPRX1 complex with the designed model. h Key residues involved in MRGPRX1 activation and signaling from the cryo-EM structures of MRGPRX1 in complex with mM1_068 and mM1_060 reveals significant differences compared to the MRGPRX1–BAM 8–22 structure.
Fig. 3.
Fig. 3.. Biophysical characterization and pharmacological properties of CXCR4 binder dCX1_001.
a A representative RFdiffusion trajectory for generating binders (blue) against the CXCR4 (yellow, PDB ID: 4RWS). Selected hot spots are highlighted in pink and de novo pentamer motifs used for scaffolding are shown in red. Inset shows deep insertion of the motif (red) and resulting binder. Receptor structure was truncated for clarity. b Computational model of the most potent CXCR4 binder, dCX1_001 (miniprotein in blue, receptor in yellow). c Size-exclusion chromatography (SEC) traces, d circular dichroism (CD) spectra and e melting curves of the dCX1_001 binder. f Functional cAMP assay of dCX1_001 binder in CHO cells stably expressing CXCR4. Data are shown as mean ± SEM (n=4). Schild regression analysis indicates dCX1_001 is an antagonist with pA2 of 7.6 ± 0.3 (25 nM) and slope of 0.68 ± 0.13).
Fig. 4.
Fig. 4.. Pharmacological characterization of GLP1R, GIPR and GCGR binders.
a, Antagonism of miniproteins dGI1_024 and mGI1_008 at the GLP1R were tested using the reporter cell line BHK21/GLP1R/Cre-luc. Cells were treated with varying concentrations of miniproteins prior to treatment with 15 pM of semaglutide, a GLP1R agonist. Both binders antagonized GLP1R signaling with IC50 values of 61 ± 20 nM for dGI1_024 and 39 ± 18 nM for mGI1_008. Exendin 9–39 was used as a positive control and had an IC50 13.9 ± 1.07 nM. Data are shown as mean ± SD (n=2). Binding affinity of miniprotein binders targeting b GIPR and c GCGR was measured by surface plasmon resonance (SPR). SPR sensorgram of binders with the highest affinity is shown. Computational design models are highlighted in blue and the target receptor in yellow.
Fig. 5.
Fig. 5.. Pharmacological characterization and cryo-EM structures of CGRPR binders.
Computational design models (blue) of MetaGen a mC1_023 b mC2_022 and RFdiffusion c dC2_049 generated antagonists bound to the CGRPR (yellow, PDB ID: 6E3Y). Receptor structures are truncated for clarity. Concentration response curves of antagonists were generated in the presence of CGRP and their functional estimates are mC1_023 (pA2 of 8.3 ± 0.1 (5 nM) and slope 0.96 ± 0.04, n=4), mC2_022 (pA2 = 7.9 ± 0.2 (13 nM), slope 0.61 ± 0.04, n=4) and dC2_049 (pA2 = 8.4 ± 0.1 (3.9 nM), slope = 0.82 ± 0.05, n=4). Selectivity profile of dC2_049 binder at the d calcitonin receptor (CTR) e adrenomedullin receptor 1 (AM1), f adrenomedullin receptor 2 (AM2), and g amylin receptor 1 (AMY1R). Data in figures are shown as mean ± SEM (n=4). h Cryo-EM maps of CGRPR bound to dC2_049 (left) and CGRPR bound to dC2_050 (right). The silhouettes show the map at low threshold to enable visualization of the detergent micelles. i Aligned models of dC2_049 (gold) and dC2_50 (purple) bound to CGRPR (colored white and gray, respectively). j Alignment of the experimental structure of dC2_049 + CGRPR with the predicted structure (colored gray) of dC2_049 and the CGRPR ectodomain. k Alignment of the experimental structure of dC2_050 + CGRPR with the predicted structure (colored gray) of dC2_050 and the CGRPR ectodomain. l Maps shown as translucent surfaces of CGRPR bound to dC2_049 (left) and dC2_050 (right) with the active state structure of CGRP bound to CGRPR (receptor and G protein not shown for clarity) aligned to the ectodomains. The densities for dC2_049 and dC2_050 sterically occlude binding of the C-terminal section of CGRP.

References

    1. Hauser A. S., Attwood M. M., Rask-Andersen M., Schiöth H. B. & Gloriam D. E. Trends in GPCR drug discovery: new agents, targets and indications. Nat. Rev. Drug Discov. 16, 829–842 (2017). - PMC - PubMed
    1. Congreve M., De Graaf C., Swain N. A. & Tate C. G. Impact of GPCR Structures on Drug Discovery. Cell 181, 81–91 (2020). - PubMed
    1. Zhang M. et al. G protein-coupled receptors (GPCRs): advances in structures, mechanisms, and drug discovery. Signal Transduct. Target. Ther. 9, 88 (2024). - PMC - PubMed
    1. Ren H. et al. Function-based high-throughput screening for antibody antagonists and agonists against G protein-coupled receptors. Commun. Biol. 3, 146 (2020). - PMC - PubMed
    1. Ma Y. et al. Structure-guided discovery of a single-domain antibody agonist against human apelin receptor. Sci. Adv. 6, eaax7379 (2020). - PMC - PubMed

Publication types

LinkOut - more resources