[Preprint]. 2025 May 29:2025.05.26.656163.
doi: 10.1101/2025.05.26.656163.

Microglial SWELL1 Deficiency Drives Male-Specific Seizure Vulnerability but Paradoxical Neuroprotection through Impaired Phagocytosis

Affiliations

Microglial SWELL1 Deficiency Drives Male-Specific Seizure Vulnerability but Paradoxical Neuroprotection through Impaired Phagocytosis

Abhijeet S Barath et al. bioRxiv. .

Abstract

The discovery of genes encoding the volume-regulated anion channel (VRAC) has enabled detailed exploration of its cell type-specific roles in the brain. LRRC8A (SWELL1) is the essential VRAC subunit. We observed seizure-induced, subunit-specific changes in microglial VRAC expression and investigated its function using conditional knockout (cKO) of LRRC8A in microglia. SWELL1 cKO mice exhibited a male-specific increase in kainate-induced seizure severity yet showed paradoxical neuroprotection against seizure-associated neuronal loss. Mechanistically, SWELL1 deletion led to a cell-autonomous reduction in microglial density and decreased release of VRAC-permeable neuroactive metabolites, including taurine, GABA, and glutamate in culture. Additionally, impaired phagocytic kinetics and reduced lysosomal biogenesis contributed to the observed neuroprotection. These findings reveal novel roles for microglial VRAC in regulating seizure outcomes and microglia-neuron interactions.

Keywords: Epilepsy; SWELL1; VRAC; microglia; neuroprotection; phagocytosis; seizures; sex-differences.


Conflict of interest statement

Competing interests The authors declare no competing interests in relation to this work.

Figures

Figure 1.
Figure 1.. Bidirectional interplay between microglial VRAC expression and seizure severity.
A) A dot plot showing changes in microglial homeostatic, epilepsy related, and LRRC8 family of genes at day 7 after kainate induced seizure in wild type mice (bulk-sequencing of brain CD11b+ cells; n = 4-5 WT mice/group) B) LRRC8a (Swell1) – LRRC8d expression in microglia at day 7 after seizures (statistic: q value i.e., false discovery rate (FDR) adjusted p-value) C) Genetics of Swell1 conditional knockout mice- stop codons are placed around the E3 exon which is spliced out after tamoxifen or 4-OHT treatment. tdTomato expression is also activated D) Relative Swell1 mRNA levels in CD11b+ and CD11b cells showing cKO efficiency and selectivity (mRNA normalized to GAPDH), vs tamoxifen (tam) treated control animals (statistic: Mann-Whitney test and unpaired t-test) E) Seizure experiment timeline F) Longitudinal Racine seizure scores in Swell1 cKO vs littermate (LM) controls (n=25-35 mice/group; statistic: 2-way ANOVA) G) Average seizure scores over the two-hour observation period (statistic: unpaired t-test) H) Percent of mice achieving a Racine score of 5 or higher at least once. I) Survival rate. 4-OHT: 4-hydroxy tamoxifen (active metabolite of tamoxifen); ICV: intracerebroventricular; KA: kainate; LM: vehicle treated littermate controls; Tam: Tamoxifen treated controls.
Figure 2.
Figure 2.. Transient microglial loss and morphological remodeling in SWELL1 cKO mice.
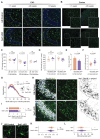
A) Microglia density in CA3 pyramidal layer of hippocampus at various time points after the last tamoxifen/ vehicle administration. Scale bar, 50 μm. B) Microglia density in cortex at various time points after the last tamoxifen/ vehicle administration. Scale bar, 50 μm. C) Quantification of microglia density in CA3 pyramidal layer (statistic: unpaired t-test or Mann-Whitney test) D) Quantification of microglia density in cortex (statistic: unpaired t-test). E) Quantification of Iba1+ area in CA3 pyramidal layer (statistic: unpaired t-test). F) Quantification of microglia territory in CA3 pyramidal layer (dot, individual microglia; 10-40 microglia/mouse, 4-5 mice/group; statistic: nested t-test). G) Sholl analysis and representative thresholded images of microglia from Swell1 cKO and LM control mice (10-40 microglia/mouse, 4-5 mice/group; statistic: 2-way ANOVA). H) Microglia (Iba1) - neuron (NeuN) interaction in CA3 pyramidal layer at 2 hours after kainate induced seizure. Scale bar, 50 μm. I) Iba1-NeuN double positive volume as a percent of CA3 pyramidal layer volume (statistic: unpaired t-test) J) Microglia soma changes at 2-hour after seizure induction. Scale bar. 20 μm. K) Quantification of microglia soma circularity in CA3 (dot, individual microglia; 90-160 microglia/mouse, 5-6 mice/group; statistic: nested t-test). L) Quantification of microglia soma size in CA3 (dot, individual microglia; 90-160 microglia/mouse, 5-6 mice/group; statistic: nested t-test). LM: vehicle treated littermate control; PL: pyramidal layer; Tam: tamoxifen; wk: weeks;
Figure 3.
Figure 3.. SWELL1 deletion impairs microglial release of neuroactive metabolites.
A) Experiment design for activation of Swell1 (VRAC channel) in purified microglia cultures with a hypotonic stimulus and collection of supernatant for neuromodulator analysis. B) (B-G) quantification of taurine, GABA, glutamate, aspartate, adenosine, and ATP levels in supernatant of Swell1 cKO vs control microglia maintained in isotonic and hypotonic conditions (dot, one well; 4-5 wells/genotype; 50,000 microglia/well; statistic: 2-way Anova with Bonferroni’s multiple comparison test). H) Experiment design to test differences in CSF and plasma metabolites after seizure induction. I) (I-K) Batch normalized taurine, GABA, and glutamate levels (statistic: Permutation test). LC/MS: Liquid chromatography/Mass spectrometry; VRAC: volume regulated anion channel
Figure 4:
Figure 4:. SWELL1 deletion confers paradoxical neuroprotection following seizures due to reduced lysosomal biogenesis.
A) Nissl staining showing neuronal loss in CA3 pyramidal layer at day3 after seizure (arrowheads, pyknotic nuclei). Scale bar, 50 μm. B) Immunofluorescence images showing neuronal loss, myeloid and CD68 responses in CA3 at day 3 after seizure. Scale bar, 50 μm for images with overlay of all channels. C) Quantification of Nissl positive cell bodies at baseline and day 3 post seizure (statistic: unpaired t-test). D) Quantification of relative NeuN positive area in CA3 at baseline and day 3 after seizure (statistic: unpaired t-test). E) Quantification of myeloid cell density in CA3 pyramidal layer at day 3 after seizure (statistic: unpaired t-test). F) Distribution and average of nearest neighbor distances for myeloid cells in CA3 pyramidal layer (statistic: Mann-Whitney test and 2-way ANOVA). G) 3D reconstructed and orthogonal views of NeuN-CD68 volumetric interactions in CA3 pyramidal layer (zoomed in view of ROIs shown subpanel B.vi and B.xii). H) Quantification of CD68+ area in CA3 at baseline and day 3 after seizures (statistic: unpaired t-test). I) Quantification of mean CD68 granule sizes at day 3 after seizures. J) (J-K) Quantification of NeuN-CD68 double positive voxels in CA3 pyramidal layer (statistic: Mann-Whiteny test). L) Correlation between CD68 + and NeuN + area in CA3 pyramidal layer at day 3 after seizure (statistic: Pearson correlation coefficient) M) 3D reconstructed and orthogonal views of Iba1-CD68 volumetric interactions in CA3 pyramidal layer (zoomed in view of same area as the ROIs shown subpanel B.vi and B.xii). N) (N-O) Quantification of Iba1-CD68 double positive voxels in CA3 pyramidal layer (statistic: unpaired t-test) P) Correlation between Iba1+ and CD68 + area in CA3 pyramidal layer at day 3 after seizure (statistic: Pearson correlation coefficient (r); simple linear regression to compare the slopes)
Figure 5.
Figure 5.. Cell-autonomous proliferative and phagocytic deficits in cultured SWELL1 cKO microglia.
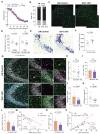
A) Microglia density at 10 days in vitro after plating purified microglia at equal density. Scale bar, 100 μm. B) Quantification of microglia density at 12 days in vitro (statistic: unpaired t-test). C) Experiment design for in vitro phagocytosis assay with opsonized latex beads. D) Bead phagocytosis assay. Scale bar, 100 μm. E) Quantification of percent microglia that are positive for phagocytic inclusions over a two-hour observation window (n = 4 wells/genotype; statistic: 2-way ANOVA) F) Quantification of average phagocytic load per microglia expressed as GFP + area (n = 4 wells/genotype; results averaged per well; statistic: 2-way ANOVA)
Figure 6.
Figure 6.. Female SWELL1 cKO mice exhibit neuroprotection without increased seizure severity.
A) Longitudinal Racine seizure scores in Swell1 cKO vs littermate (LM) controls. (n=15-24 mice/group; statistic: 2-way ANOVA) B) Survival rate. C) Microglia density in cortex at 4-6 weeks after the last tamoxifen/ vehicle administration. Scale bar, 50 μm. D) Quantification of microglia density in cortex and CA3 (statistic: unpaired t-test and Mann-Whitney test respectively) E) Nissl staining showing neuronal loss in CA3 pyramidal layer at day 3 after seizure. Scale bar, 50 μm. F) Quantification of Nissl positive cell bodies at day 3 post seizure (statistic: unpaired t-test). G) Immunofluorescence images showing neuronal loss, myeloid and CD68 responses in CA3 at day 3 after seizure. Scale bar, 50 μm for images with overlay of all channels. H) (H-I) Quantification of myeloid cell density and Iba1+ area in CA3 pyramidal layer at day 3 after seizure (statistic: unpaired t-tests). J) (J-K) Quantification of CD68+ area and mean granule size in CA3 at day 3 after seizures (statistic: unpaired t-tests). L) Quantification of NeuN-CD68 double positive voxels in CA3 pyramidal layer (statistic: unpaired t-test). M) Correlation between CD68 + and NeuN + area in CA3 pyramidal layer at day 3 after seizure (statistic: Pearson correlation coefficient) N) Quantification of Iba1-CD68 double positive voxels in CA3 pyramidal layer as a percent of Iba1+ volume (statistic: unpaired t-test). O) Correlation between Iba1+ and CD68 + area in CA3 pyramidal layer at day 3 after seizure (statistic: Pearson correlation coefficient; simple linear regression to compare the slopes)

Similar articles

References

    1. Eyo U. B., Murugan M., Wu L.-J., Microglia–Neuron Communication in Epilepsy. Glia 65, (2017). - PMC - PubMed
    1. Umpierre A. D., Wu L.-J., How microglia sense and regulate neuronal activity. Glia 69, (2021). - PMC - PubMed
    1. Wyatt-Johnson S. K., Brewster A. L., Emerging Roles for Microglial Phagocytic Signaling in Epilepsy. Epilepsy Currents 20, (2019). - PMC - PubMed
    1. Dardiotis E., Siokas V., Pantazi E., Dardioti M., Rikos D., Xiromerisiou G., Markou A., Papadimitriou D., Speletas M., Hadjigeorgiou G. M., A novel mutation in TREM2 gene causing Nasu-Hakola disease and review of the literature. Neurobiology of Aging 53, (2017). - PubMed
    1. Papapetropoulos S., Pontius A., Finger E., Karrenbauer V., Lynch D. S., Brennan M., Zappia S., Koehler W., Schoels L., Hayer S. N., Konno T., Ikeuchi T., Lund T., Orthmann-Murphy J., Eichler F., Wszolek Z. K., Adult-Onset Leukoencephalopathy With Axonal Spheroids and Pigmented Glia: Review of Clinical Manifestations as Foundations for Therapeutic Development. Frontiers in Neurology 12, (2022). - PMC - PubMed

Publication types

LinkOut - more resources