[Preprint]. 2025 May 30:2025.05.28.656654.
doi: 10.1101/2025.05.28.656654.

Disease-causing mutations in the G protein β5 β-propeller disrupt its chaperonin-mediated folding trajectory

Affiliations

Disease-causing mutations in the G protein β5 β-propeller disrupt its chaperonin-mediated folding trajectory

Mikaila I Sass et al. bioRxiv. .

Abstract

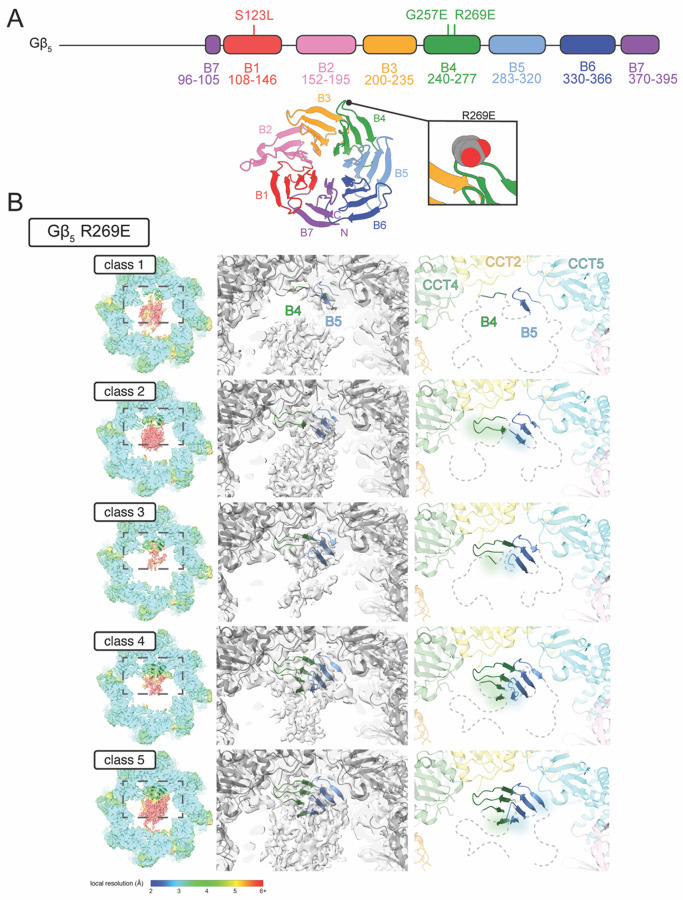
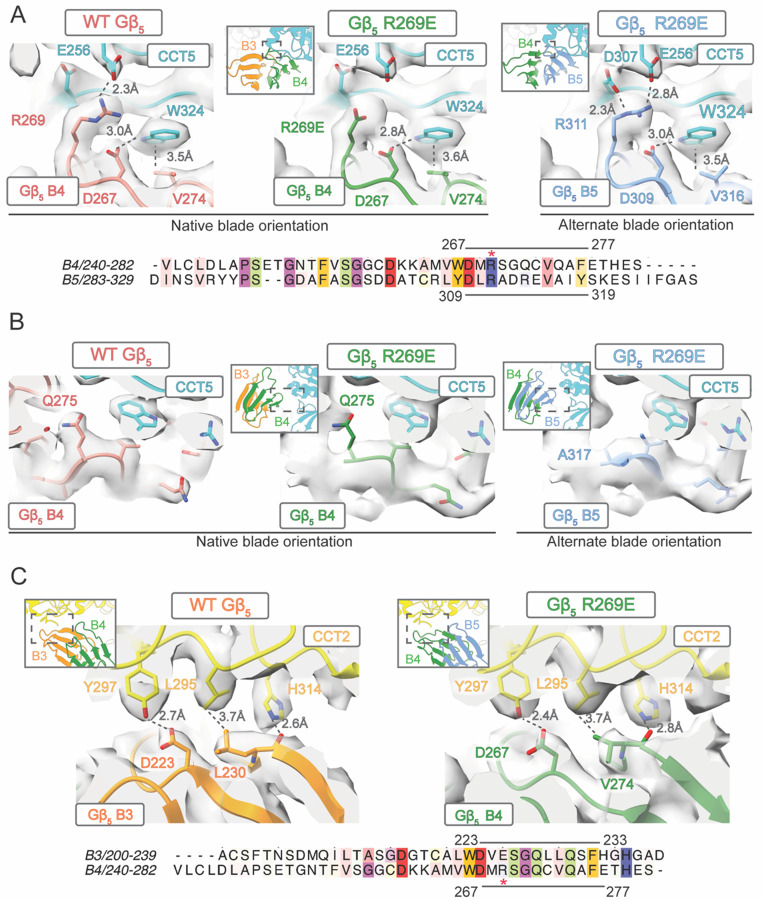
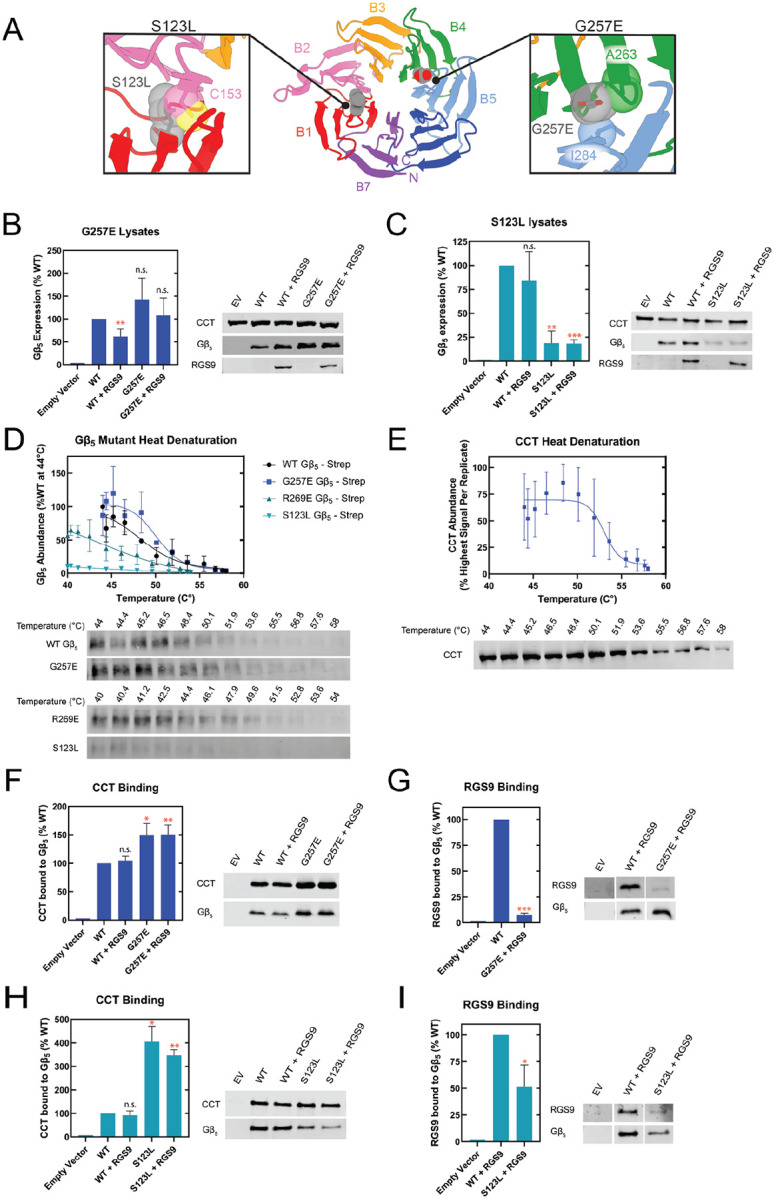
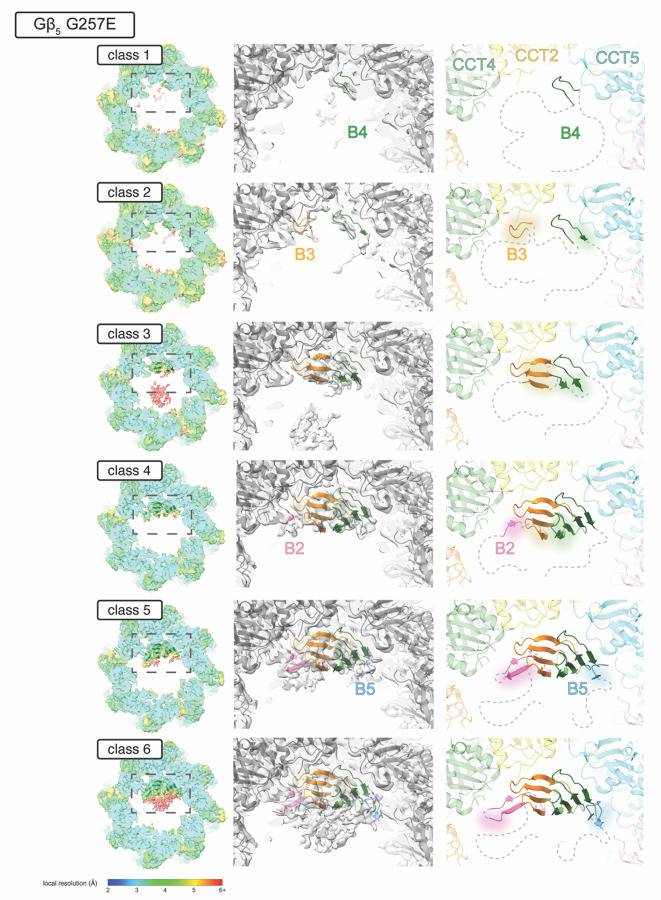
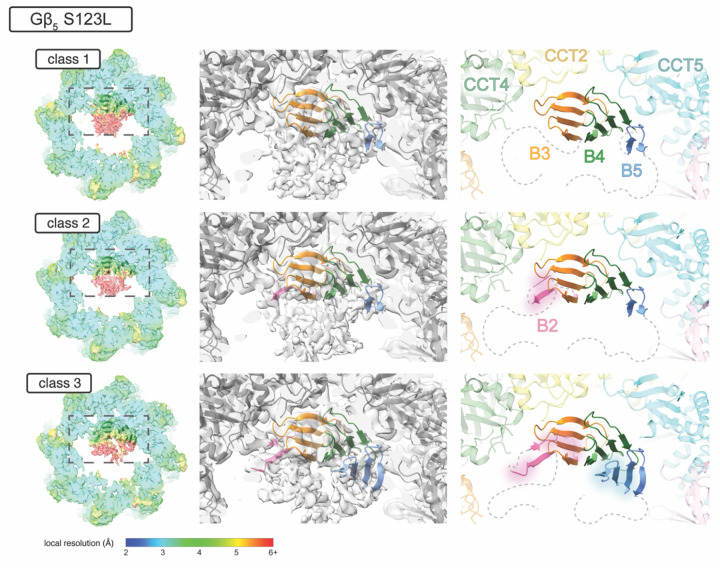
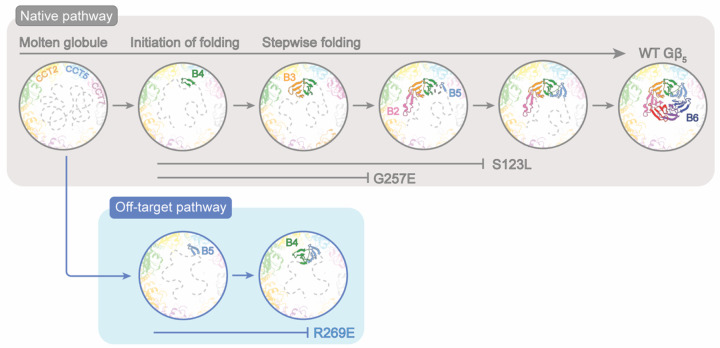
The Chaperonin Containing Tailless polypeptide 1 (CCT or TRiC) is an essential cytosolic chaperone that folds multiple protein substrates, including many with β-propeller folds. One β-propeller substrate is the G protein β5 subunit (Gβ5) of Regulator of G protein Signaling (RGS) complexes that determine the duration of G protein signals in neurons. In recent work, we used cryo-electron microscopy (cryo-EM) to visualize the complete CCT-mediated folding trajectory for Gβ5, from an initiating electrostatic interaction of a single β-strand in Gβ5 with CCT5 to a completely folded β-propeller structure. Here, we used biochemistry and cryo-EM to determine how missense mutations in Gβ5, including those that cause severe neurological diseases, alter the Gβ5 folding trajectory and lead to incompletely folded, trapped intermediates. These findings highlight how defects in chaperonin-mediated folding contribute to disease and suggest potential strategies for stabilizing misfolded proteins to restore function.

Keywords: G protein; chaperonin; cryo-electron microscopy; missense mutations; protein folding.


Conflict of interest statement

Competing Interest Statement: The authors declare no competing interests.

Figures

Figure 1.
Figure 1.. Folding trajectory of Gβ5 R269E.
(A) Domain organization and ribbon structure of Gβ55. The inset indicates the location of the R269E mutation. (B) Structural analysis of Gβ55 R269E reconstructions. Each row depicts an intermediate of Gβ55 R269E folding ordered from least to most folded. Left columns show the reconstruction density colored by local resolution with Gββ55 R269E structural models in green ribbons. Middle columns show an inset of the Gβ55 R269E models with colored ribbons according to blade number and CCT models as gray ribbons overlayed on the reconstruction density. Right columns show the corresponding inset of structural models. Unstructured regions are indicated as dashed lines. Advances in folding are indicated with a glow effect surrounding the ribbons.
Figure 2.
Figure 2.. Alternate initiation of Gβ5 R269E.
(A) Top – Series of electrostatic interactions between CCT5 and blade 4 of WT Gβ5 (left), Gβ5 R269E in the native blade orientation (middle), or Gβ5 R269E in the alternate blade orientation (right). Insets indicate the location of the region being examined in the complex. Bottom – sequence alignment of WT Gβ5 blade 4 (B4) and blade 5 (B5). The residues comprising the outer β-hairpin of each blade are indicated by a line with first and last residues numbered. The location of R269 is marked with a red asterisk. (B) Comparison of the fit of Q275 and A317 into the density organized as in (A). (C) Top – interactions between WT Gβ5 blade 3 and CCT2 in the native orientation (left) and between Gβ5 R269E blade 4 and CCT2 in the alternate orientation (right). Insets indicate the location of the region being examined in the complex. Bottom – sequence alignment of WT Gβ5 blade 3 (B3) and blade 4 (B4). The residues of the outer β-hairpin of each blade are indicated by a line with first and last residues numbered. The location of R269 is marked with a red asterisk.
Figure 3.
Figure 3.. Mutant Gβ5 binding to CCT and RGS9.
(A) Schematic representation of Gβ5 with insets highlighting the G257E and S123L mutations as well as their predicted clashes with neighboring blades. (B) Cellular expression levels of G257E (n = 4) and (C) S123L compared to WT Gβ5 (n = 3). Bar graphs show the average ± standard deviation. Representative immunoblots are shown on the right of the graphs. (D) Thermal stability curves for the Gβ5 variants compared to WT Gβ5 (n = 3). Temperature ranges were adjusted depending on the stability of the variants. Error bars that do not extend beyond the symbols are not seen. Representative immunoblots are shown below the graphs. (E) Thermal stability curve for CCT (n = 6). Graphs show the average ± standard deviation of the CCT2 band intensity normalized to the highest value from each replicate. (F) The amount of CCT bound to Gβ5 G257E (n = 4), and (G) the amount of RGS9 bound to Gβ5 G257E relative to WT Gβ5 (n = 4). (H) The amount of CCT bound to Gβ5 S123L (n = 3), and (I) the amount of RGS9 bound to Gβ5 S123L relative to WT Gβ5 (n = 3). All CCT and RGS9 quantifications were normalized to the amount of immunoprecipitated Gβ5. Statistical significance was determined using t-tests compared to WT Gβ5 (* p < 0.05, ** p < 0.01, *** p < 0.001, n.s. = not significant).
Figure 4.
Figure 4.. Folding Trajectory of Gβ5 G257E.
Each row depicts an intermediate in Gβ5 G257E folding ordered from least to most folded. Views in the three columns are as in Figure 1.
Figure 5.
Figure 5.. Folding Trajectory of Gβ5 S123L.
Each row depicts an intermediate in Gβ5 S123L folding ordered from least to most folded. Views in the three columns are as in Figure 1.
Figure 6.
Figure 6.. Model of Gβ5 mutant folding.
Model depicting key steps in the folding of Gβ5, including the off-target pathway for the R269E variant and the point where folding is disrupted by the S123L and G257E mutants.

Similar articles

References

    1. Katritch V., Cherezov V., Stevens R. C., Structure-function of the G protein-coupled receptor superfamily. Annu Rev Pharmacol Toxicol 53, 531–556 (2013). - PMC - PubMed
    1. Wettschureck N., Offermanns S., Mammalian G proteins and their cell type specific functions. Physiol Rev 85, 1159–1204 (2005). - PubMed
    1. Syrovatkina V., Alegre K. O., Dey R., Huang X. Y., Regulation, Signaling, and Physiological Functions of G-Proteins. J Mol Biol 428, 3850–3868 (2016). - PMC - PubMed
    1. Gilman A. G., G proteins: transducers of receptor-generated signals. Annu Rev Biochem 56, 615–649 (1987). - PubMed
    1. Rasmussen S. G. et al. , Crystal structure of the beta2 adrenergic receptor-Gs protein complex. Nature 477, 549–555 (2011). - PMC - PubMed

Publication types

LinkOut - more resources