[Preprint]. 2025 Jun 3:2025.05.30.657115.
doi: 10.1101/2025.05.30.657115.

PTBP1 Depletion in Mature Astrocytes Reveals Distinct Splicing Alterations Without Neuronal Features

Affiliations

PTBP1 Depletion in Mature Astrocytes Reveals Distinct Splicing Alterations Without Neuronal Features

Min Zhang et al. bioRxiv. .

Abstract

Astrocyte-to-neuron reprogramming via depletion of PTBP1, a potent repressor of neuronal splicing, has been proposed as a therapeutic strategy, but its efficacy remains debated. While some reported successful conversion, others disputed this, citing a lack of neuronal gene expression as evidence of failed reprogramming. This interpretation was further challenged, attributed to incomplete PTBP1 inactivation, fueling ongoing controversy. Mechanistic understanding of the conversion, or the lack thereof, requires investigating, in conjunction with lineage tracing, the effect of Ptbp1 loss of function in mature astrocytes on RNA splicing, which has not yet been examined. Here, we genetically ablated PTBP1 in adult Aldh1l1-Cre/ERT2 Ai14 mice to determine whether lineage traced Ptbp1 knockout astrocytes exhibited RNA splicing alterations congruent with neuronal differentiation. We found no widespread induction of neurons, despite a minuscule fraction of knockout cells showing neuron-like transcriptomic signatures. Importantly, PTBP1 loss in mature astrocytes induced splicing alterations unlike neuronal splicing patterns. These findings suggest that targeting PTBP1 alone is ineffective to drive neuronal reprogramming and highlight the need for combining splicing and lineage analyses. Loss of astrocytic PTBP1 is insufficient to induce neuronal splicing, contrasting with its well-known role in other non-neuronal cells, and instead affects a distinct astrocytic splicing program.


Figures
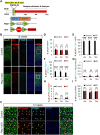
Figure 1.
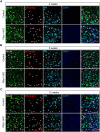
Figure 1.. Ptbp1 depletion does not effectively induce the astrocyte-to-neuron conversion in mouse cortex
(A) Schematic workflow to genetically generate the adult astrocyte specific Ptbp1 cKO mouse model and timeline of tamoxifen administration and sample collection. (B) Representative images of mouse cortex collected 12 weeks after tamoxifen injection. White boxes indicate the location of images shown in Figure 1C (Scale bars are 100 μm). (C) Representative immunostaining images of mouse cortex collected 12 weeks after tamoxifen IP injection. White arrowheads in the control panels indicate the expression of PTBP1 in tdTomato+ (tdT+) astrocytes. Yellow arrowheads indicate PTBP1 was successfully depleted in Ptbp1 cKO astrocytes. The absence of NeuN and tdTomato double-positive (NeuN+tdT+) cells demonstrates no astrocyte-to-neuron conversion with Ptbp1 depletion. Scale bars are 100 μm. (D) Quantification of tdT+ astrocyte proportion at 4, 8, and 12 weeks following tamoxifen induction. (E-F) Quantification of Ptbp1 knockout efficiency in control and Ptbp1 cKO mouse cortex at 4, 8, and 12 weeks following tamoxifen induction. (G) Quantification of PTBP1+NeuN+ double positive cells indicating PTBP1 is not expressed in neurons. (H) Quantification of NeuN+tdT+ cells indicating the absence of astrocyte-to-neuron conversion. (I) Quantification of NeuN+ cells at 4, 8, and 12 weeks following tamoxifen induction showing no changes in the proportion of neurons in control or Ptpb1 cKO cortex. Animal numbers are n = 3 for both control and KO groups at all three time points. For quantification, the individual cortical images taken per brain are N=20–24 for 4 weeks, 7–10 for 8 weeks and 10–20 for 12 weeks. The quantification results represent the average and stdev of biological replicates (n). The significance test was carried out by t-test, *p< 0.05, **p< 0.01, ***p< 0.001 and “ns” means no difference with p>0.05.
Figure 2.
Figure 2.. Ptbp1 depletion does not induce the astrocyte-to-neuron transition in striatum.
(A) Representative images of control and Ptbp1 cKO mouse striatum collected 12 weeks after tamoxifen injection. White boxes indicate the location of images shown in Figure 2B. Scale bars are 100 μm. (B) Representative immunostaining images of mouse striatum collected 12 weeks after tamoxifen induction. White arrowheads in the control panels indicate the expression of PTBP1 in astrocytes (tdT+ cells). Yellow arrowheads indicate the efficient PTBP1 depletion in Ptbp1 cKO astrocytes. The absence of NeuN+tdT+ cells in the striatum demonstrates no astrocyte-to-neuron conversion with Ptbp1 depletion. Scale bars are 100 μm. (C) Quantification of striatal tdT+ astrocyte proportion at 4, 8, and 12 weeks following tamoxifen induction. (D-E) Quantification of Ptbp1 knockout efficiency in control and Ptbp1 cKO mouse striatum at 4, 8, and 12 weeks following tamoxifen induction. (F) Quantification of PTBP1+NeuN+ double positive cells indicating PTBP1 is not expressed in striatal neurons. (G) Quantification of NeuN+tdT+ cells indicating absence of astrocyte-to-neuron conversion in the striatum. (H) Quantification of NeuN+ cells at 4, 8, and 12 weeks following tamoxifen induction showing minimal changes in the proportion of neurons in control or Ptbp1 cKO striatum. Animal numbers are n=3 for both control and KO groups at all three time points. For quantification, the individual cortical images taken per brain are N=4–6 for 4 weeks, 3–6 for 8 weeks and 4–6 for 12 weeks. The quantification results represent the average and stdev of biological replicates (n). The significance test was carried out by t-test, *p< 0.05, **p< 0.01, ***p< 0.001 and “ns” means no difference with p>0.05.
Figure 3.
Figure 3.. Ptbp1 depletion does not induce the astrocyte-to-neuron transition in substantia nigra.
(A-C) Representative images of the immunostaining results (substantia nigra) of the mouse brains collected at 4 weeks (A), 8 weeks (B), 12 weeks (C) after tamoxifen induction. White arrowheads indicate the locations of astrocytes (tdT+ cells). However, none of the tdT+ cells express either NeuN or TH. The absence of NeuN or TH and tdTomato double positive cells reveals no astrocyte-to-neuron conversion in Ptbp1 cKO. Scale bars are 100um. Animal numbers are n=3 for both control and KO groups at all the three time points expect for the control group at 8 weeks (n=2).
Figure 4.
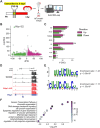
Figure 4.. Widespread splicing changes in Ptbp1 cKO astrocytes.
(A) Schematic of the experimental design of bulk RNA-seq. (B) Volcano plot of differential splicing analysis, highlighting the significant exon 2 skipping in Ptbp1 in the cKO samples. Upregulated events are highlighted in pink and downregulated events in green. (C) Bar plot showing the number of DSEs identified in eight types of alternative splicing events. SE: Skipped exon, FIVE: Alternative 5´ prime splice site, THREE: Alternative 3´ prime splice site, MXE: Mutually exclusive exons, RI: Retained intron, AFE: Alternative first exon, ALE: Alternative last exon, MSE: Multiple skipped exons. (D) Genome browser track of the Ptbp1 gene locus and its exon 2 (E2) with RNA-seq signals of control and Ptbp1 cKO samples. (E) Enriched motifs in 3´ spliced sites of differentially spliced skipped exons by Ptbp1 cKO. (F) Gene ontology enrichment analysis of differentially spliced genes in Ptbp1 cKO astrocytes. The coronal section drawing in (A) was created using BioRender (https://www.biorender.com/).
Figure 5.
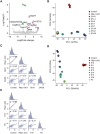
Figure 5.. Impact of Ptbp1 loss on astrocyte splicing profiles.
(A) PCA of PSI values across control, Ptbp1 cKO astrocytes, and in vitro differentiated neuron samples at various differentiation stages (DIV-8, DIV-4, DIV0, DIV1, DIV7, DIV16, DIV21, and DIV28). (B) Spearman’s correlation analysis of PSI values between control, Ptbp1 cKO astrocytes, and in vitro differentiated neuron samples (DIV0 and DIV28). (C) Scatter plot of dPSI in Ptbp1 cKO astrocytes (cKO vs. Control) against splicing changes in in vitro differentiated neurons (DIV28 vs. DIV0). Splicing events are categorized into eight functional groups (F1-F8). (D) Bar plot showing the number of alternative splicing events in each functional category (F1-F8).
Figure 6.
Figure 6.. Minimal gene expression changes in Ptbp1 cKO astrocytes.
(A) Volcano plot showing DEGs between control and Ptbp1 cKO astrocyte samples. Upregulated genes are highlighted in pink and downregulated genes in green. (B) PCA of TPM values across control, Ptbp1 cKO astrocytes, and in vitro differentiated neuron samples at various differentiation stages (DIV-8, DIV-4, DIV0, DIV1, DIV7, DIV16, DIV21, and DIV28). (C) Spearman’s correlation analysis comparing TPM values between control, Ptbp1 cKO astrocytes, and in vitro differentiated neuron samples (DIV0 and DIV28). (D) PCA of TPM values across control, Ptbp1 cKO astrocytes, and cortical tissue samples at various developmental stages (E10, E11, E12, E13, E14, E15, E16, and P0). (E) Spearman’s correlation analysis comparing TPM values between control, Ptbp1 cKO astrocytes, and cortical tissue samples (E10 and P0).
Figure 7.
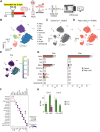
Figure 7.. Single-cell RNA-Seq analysis of Ptbp1 cKO astrocytes shows limited astrocyte-to-neuron conversion.
(A) Schematic of the experimental design of single-cell RNA-seq. (B) UMAP plot of all identified cell types based on gene expression profiles. Cells were classified into ten distinct cell types: astrocytes (Astro), excitatory neurons (Exc), inhibitory neurons (Inh), microglia (Micro), immune cells (Immune), oligodendrocytes (OL), endothelial cells (Endo), pericytes (Peri), vascular leptomeningeal cells (VLMC), and ependymal cells (Ependymal). Two excitatory neuron subpopulations, Exc-1 and Exc-2, are highlighted. (C-D) UMAP plots showing the distribution of cells in control (n = 10,851) (C) and Ptbp1 cKO (n = 8,594) (D) samples. (E) The Cre transgene expression projected on the UMAP plot. (F) Dot plot representing the expression of marker genes across identified cell types. (G) Bar plot showing the proportion of each cell type in control and Ptbp1 cKO samples. (H) Bar plot showing the number of Cre-negative and Cre-positive cells in Exc-1 and Exc-2 clusters for control and Ptbp1 cKO samples. The coronal section drawing in (A) was created using BioRender (https://www.biorender.com/).

Similar articles

References

    1. Bocchi R., Masserdotti G. & Götz M. Direct neuronal reprogramming: Fast forward from new concepts toward therapeutic approaches. Neuron 110, 366–393 (2022). - PubMed
    1. Mertens J. et al. Directly Reprogrammed Human Neurons Retain Aging-Associated Transcriptomic Signatures and Reveal Age-Related Nucleocytoplasmic Defects. Cell Stem Cell 17, 705–718 (2015). - PMC - PubMed
    1. Yang Y. et al. Enhanced Rejuvenation in Induced Pluripotent Stem Cell-Derived Neurons Compared with Directly Converted Neurons from an Aged Mouse. Stem Cells Dev. 24, 2767–2777 (2015). - PubMed
    1. Matsuda T. et al. Pioneer Factor NeuroD1 Rearranges Transcriptional and Epigenetic Profiles to Execute Microglia-Neuron Conversion. Neuron 101, 472–485.e7 (2019). - PubMed
    1. Yoo A. S. MicroRNA-mediated conversion of human fibroblasts to neurons. Nature 476, 228–231 (2011). - PMC - PubMed

Publication types

LinkOut - more resources