[Preprint]. 2025 Jun 3:2025.06.03.657415.
doi: 10.1101/2025.06.03.657415.

Transcription factors SP5 and SP8 drive primary cilia formation

Affiliations

Transcription factors SP5 and SP8 drive primary cilia formation

Yinwen Liang et al. bioRxiv. .

Update in

Abstract

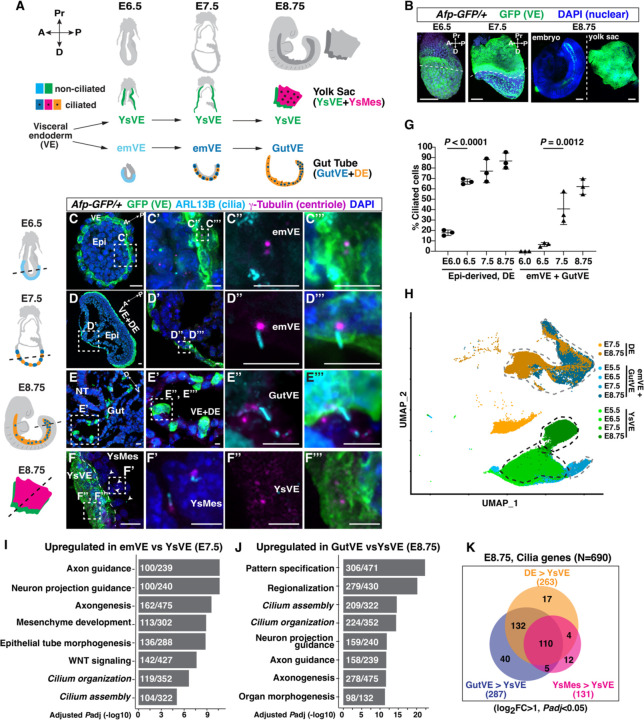
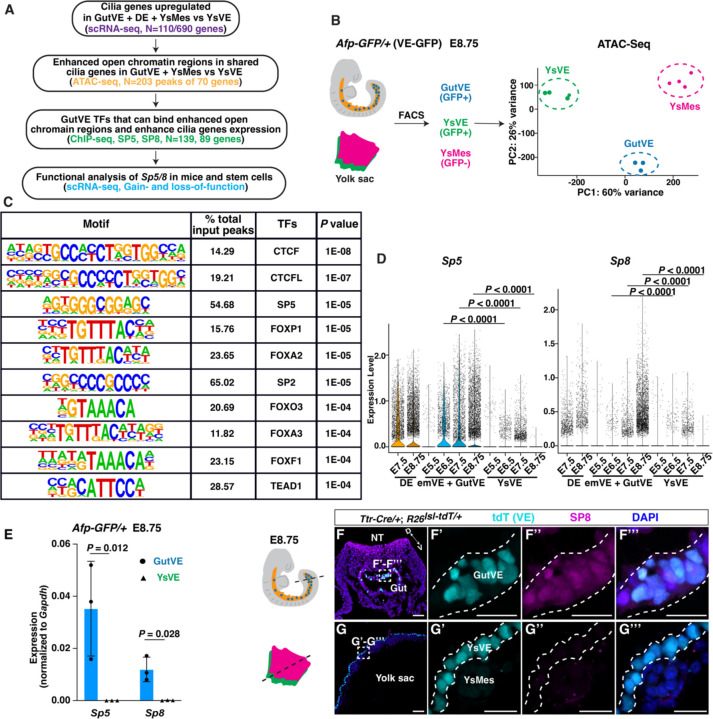
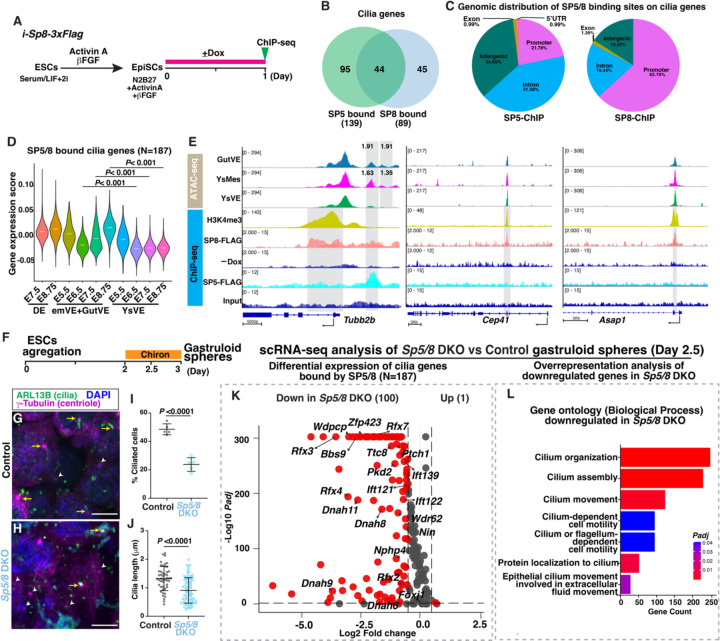
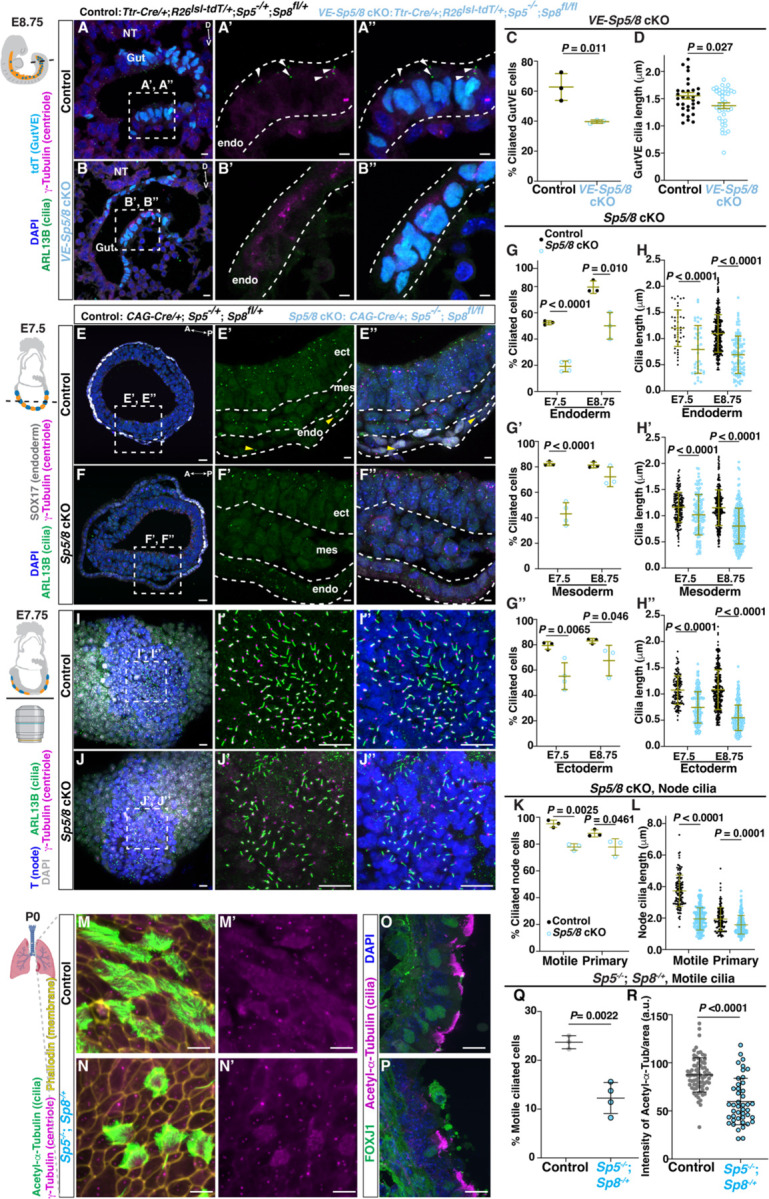
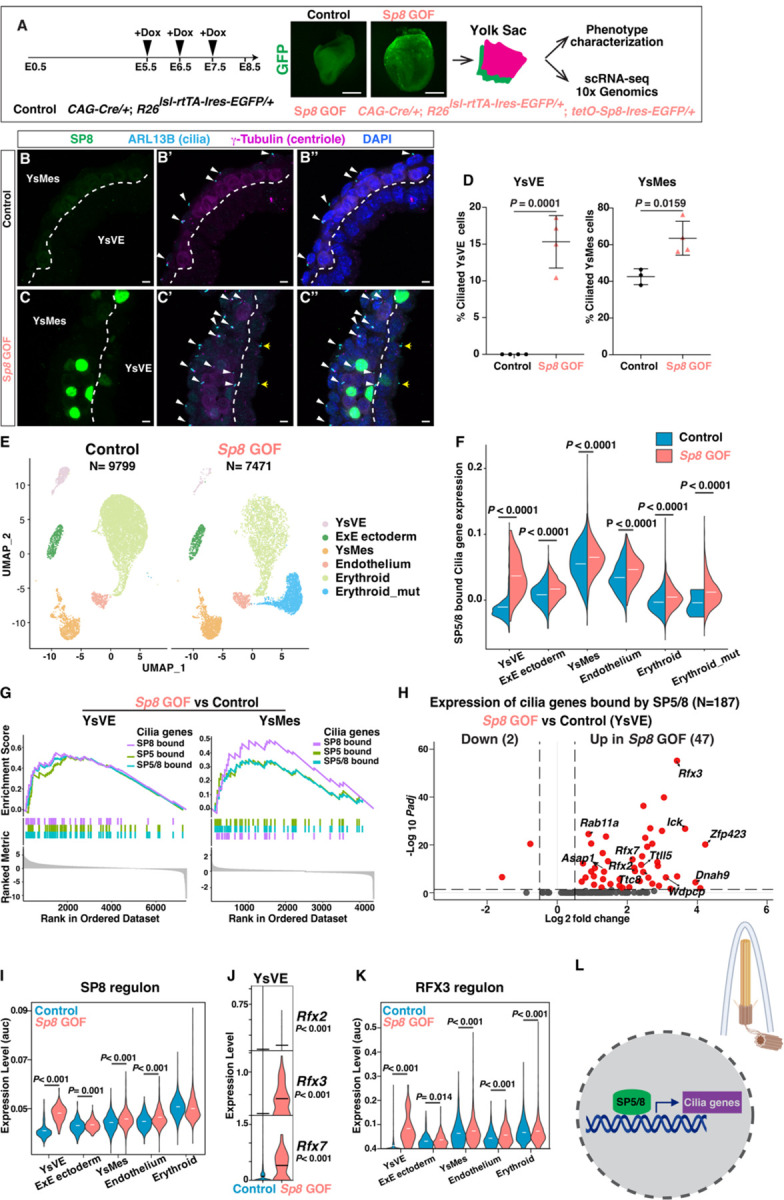
While specific transcription factors are known to regulate cell fate decisions, the degree to which they can stimulate formation of specific cell organelles is less clear. We used a multi-omics comparison of the transcriptomes of ciliated and non-ciliated embryonic cells to identify transcription factors upregulated in ciliated cells, and conditional genetics in mouse embryos and stem cells to demonstrate that SP5/8 regulate cilia formation and gene expression. In Sp5/8 mutant embryos primary and motile cilia are shorter than normal and reduced in number across cell types, contributing to situs inversus and hydrocephalus. Moreover, expression of SP8 is sufficient to induce primary cilia in unciliated cells. This work opens new avenues for studying cilia assembly using stem cell models and offers new insights into human ciliopathies.


Conflict of interest statement

Competing interests: The authors declare no competing financial interests.

Figures

Fig. 1.
Fig. 1.. VE-derived emVE cells form cilia during intercalation with DE to form gut.
(A) Schematic showing that the extraembryonic visceral endoderm (VE) lineage generates yolk sac VE (YsVE, green) and embryonic VE (emVE, cyan). emVE intercalates with embryo-derived definitive endoderm (DE, orange) of the gut to become gut VE (GutVE, blue). Ys also contains embryo-derived mesoderm (YsMes, pink). Black dots, ciliated cells. The schematics of embryos in (A) and beside (C-E) were modified from (21). (B) Wholemount images of Afp-GFP/+ embryos. Extra-embryonic tissue, above dashed line (E6.5, E7.5); Ys, right (E8.75); Pr, proximal; D, distal. (C-F) Immunofluorescent (IF) staining of transverse sections of Afp-GFP/+ embryos. Schematics indicate section level. Arrowheads, ciliated YsMes (F); D, dorsal; V, ventral; epi, epiblast; A, anterior; P, posterior. Scale bar, 1mm (B); 20μm low magnification, 5μm insets (C-F). (G) Quantification of the percentage ciliated emVE and GutVE (E6.0-E8.75), epiblast-derived cells (E6.0-E7.5), and DE (E8.75). Statistical analysis: one-way ANOVA (N=3 embryos/stage). (H) Uniform Manifold Approximation and Projection (UMAP) plot showing clustering of cells (scRNA-seq from (15)). (I, J) Bar plots of the top 6 upregulated biological processes and cilium-related terms in E7.5 emVE (I), the top 8 upregulated biological processes in E8.75 GutVE (J) compared to YsVE. Input gene cutoff log2Fold Change>1; Padj<0.05. Gene sets are ranked by Padj. The numbers in the boxes indicate the number of upregulated genes per total gene number per term. See also table S2, S3. (K) Venn diagram showing the overlap of upregulated cilia genes in GutVE, DE, or YsMes compared to YsVE at E8.75 (N=690 cilia genes, table S1).
Fig. 2.
Fig. 2.. Chromatin accessibility analysis of core ciliome genes in GutVE and YsM compared to YsVE identifies SP/KLF TF families.
(A) Study design, scRNA-seq and ATAC-seq in E8.75 embryo and ChIP-seq in ES cell lines. (B) Schematic diagram showing ATAC-seq sample preparation (left) and scatter plot (right) of sample clustering from principal component analysis (PCA) of GutVE, YsMes, and YsVE (N=3, 4, 4 samples). See also tables S11–15. (C) Enrichment of transcription factor recognition sequences in 203 differential ATAC-seq peaks in 70 of the shared cilia genes in GutVE and YsMes versus YsVE. The list is ranked based on P value. See also table S15. (D) Violin plot showing the log10 CPM (counts per million) expression levels of Sp5 and Sp8 from scRNA-seq data. See also table S17. (E) qRT-PCR quantification of Sp5, Sp8 mRNA expression normalized to Gapdh. (F, G) IF staining of transverse sections for SP8, tdT (VE lineage cells), and DAPI in the gut tube (F) and yolk sac (G) of E8.75 Ttr-Cre/+; R26lsl-tdT/+ embryos. (F’-F’’’, G’-G’’’) Higher magnification images of insets in (F, G). D, dorsal; V, ventral. Scale bar, 50μm, insets 20μm. The schematic of the embryo in (B) and beside (F) was modified from (21). Statistical analyses: Wilcoxon rank-sum test (D), unpaired t-test (E).
Fig. 3.
Fig. 3.. SP5/8 bind and activate cilia genes.
(A) Experimental design. (B) Venn diagram showing the overlap of cilia genes bound by SP5 and SP8. See also tables S19, S20. (C) Gene distribution of SP5/8 binding sites in cilia genes. (D) Violin plots showing composite expression levels of SP5/8 bound cilia genes (N=187) in DE, GutVE, and YsVE at E5.5-E8.75. (E) ATAC-seq plots of cilia genes in GutVE, YsMes, YsVE and ChIP-seq tracks of H3K4me3 and SP8-FLAG in EpiSCs and SP5-FLAG in embryoid bodies. Grey boxes indicate significance of the peak comparisons of ATAC-seq and ChIP-seq data. The number above ATAC-seq tracks represents fold change in a single 500 bp peak with Padj<0.05. Y-axis scale was chosen to optimize the visualization of peaks for each sample. (F) Schematic showing derivation of gastruloid spheres from ESCs. (G, H) IF staining of WT and Sp5/8 DKO ESCs derived day 2.5 gastruloid spheres. Yellow arrows indicate ciliated cells; white arrow heads indicate unciliated cells. (I, J) Quantification of the percentage of ciliated cells (I) and cilia length (J) in WT and Sp5/8 DKO gastruloid spheres (N=5 technical replicates/genotype). (K) Volcano plot showing the differential expression of SP5/8 bound cilia genes (N=187) in Sp5/8 DKO vs WT gastruloid spheres (table S22). (L) Overrepresentation analysis of downregulated genes in Sp5/8 DKO vs WT gastruloid spheres showing the enrichment of cilia-related gene sets (table S23). Statistical analyses: Wilcoxon rank-sum test (D), unpaired t-test (I, J). Scale bars, 5μm (G, H).
Fig. 4.
Fig. 4.. SP5/8 are required for primary cilia formation across tissues.
(A, B) IF staining of transverse sections of Control and VE-Sp5/8 cKO embryonic gut tube. Arrowhead, ciliated GutVE; NT, neural tube; D, dorsal; V, ventral. (C, D) Quantification of the percentage of ciliated cells and cilia length (D). (E, F) IF staining of transverse sections of Control and Sp5/8 cKOs. Ect, ectoderm; mes, mesoderm; end, endoderm. Note, in the Sp5/8 cKOs endoderm, ARL13B signal in cytoplasm is unspecific. (G, H) Quantification of the percentage of ciliated cells (G-G’’) and cilia length (H-H’’) in three cell types. n≥3 animals/genotype. (I, J) Maximum intensity projection ventral view of wholemount IF staining of Control (I) and Sp5/8 cKO (J) embryos in the node. (K, L) Quantification of percentage node ciliated cells (K) and cilia length (L) based on their position and Brachyury (T) expression (N=3 embryos/genotype). Motile and primary cilia are distinguished based on their localization at the center of the node (node pitch) or peripheral to it. (M, N) En face imaging of distal part of trachea in control and Sp5−/−; Sp8-/+ P0 neonates stained for cilia and membrane markers. Schematic created from Biorender.com. (O, P) IF staining of sagittal sections of trachea in control and Sp5−/−; Sp8-/+ animals at P0. (Q, R) Quantification of the percentage of motile ciliated cells (Q), and intensity of Acetyl-α-Tubulin fluorescence (R). Scale bar, 20μm (A, B, E, F, I, J); 20μm (M-P); 5μm insets. The schematics of the embryos beside (A, E, I) were modified from (21). Statistical analyses: unpaired t-test (C, D, Q, R), one-way ANOVA (G, H, K, L).
Fig. 5.
Fig. 5.. SP8 is sufficient to induce primary cilia in YsVE.
(A) The strategy of global Sp8 gain-of-function (GOF) (top) for phenotype characterization and scRNA-seq analysis in Control and Sp8 GOF E8.75 embryos. (B, C) IF staining of transverse sections of yolk sac tissues from Control (B) and Sp8 GOF (C) E8.5 embryos. White arrowheads, ciliated YsMes; yellow arrows, ciliated YsVE in Sp8 GOF mutants. (D) Quantification of the percentage of ciliated YsVE and YsMes cells in Control and Sp8 GOF yolk sacs (N≥3 tissues/genotype). (E) UMAP plots showing clustering of cell types of Control and Sp8 GOF yolk sac tissues (N=3, 2 replicates). (F) Violin plots showing the gene set expression levels of SP5/8 bound cilia genes (N=187) across cell types in Control and Sp8 GOF yolk sac cell types. (G) Gene set enrichment plots showing that SP5-bound, SP8-bound, or combined SP5/8-bound cilia genes are enriched in Sp8 GOF group vs Control in YsVE and YsMes cell types. (H) Volcano plot showing the differential expression of SP5/8 bound cilia genes in YsVE cells, comparing Sp8 GOF to Control (table S24). (I) Violin plots depicting the AUC (Area Under the Curve) score of SP8 regulon across different cell types in Control and Sp8 GOF samples. (J) Violin plots showing log10 CPM (counts per million) expression levels of Rfx2, Rfx3 and Rfx7 in YsVE of Control and Sp8 GOF samples. (K) Violin plot depicting the AUC score of RFX3 regulon across different cell types in Control and Sp8 GOF samples. (L) Schematic showing SP5/8 bind and activate a set of primary cilia genes (N=130 for SP5, N=84 for SP8), and some motile cilia genes (N=9 for SP5, N=5 for SP8) in the nucleus to promote cilia formation (top right). Scale bars, 250 μm (A), 5μm (B, C). Statistical analysis: unpaired t-test (D, J), Wilcoxon rank-sum test (F, I, K).

References

    1. Anvarian Z., Mykytyn K., Mukhopadhyay S., Pedersen L. B., Christensen S. T., Cellular signalling by primary cilia in development, organ function and disease. Nat Rev Nephrol 15, 199–219 (2019). - PMC - PubMed
    1. Goetz S. C., Anderson K. V., The primary cilium: a signalling centre during vertebrate development. Nat Rev Genet 11, 331–344 (2010). - PMC - PubMed
    1. Reiter J. F., Leroux M. R., Genes and molecular pathways underpinning ciliopathies. Nat Rev Mol Cell Biol 18, 533–547 (2017). - PMC - PubMed
    1. H. M. Mitchison, E. M. Valente, Motile and non-motile cilia in human pathology: from function to phenotypes. J Pathol 241, 294–309 (2017). - PubMed
    1. Santos N., Reiter J. F., Building it up and taking it down: the regulation of vertebrate ciliogenesis. Dev Dyn 237, 1972–1981 (2008). - PMC - PubMed

Publication types

LinkOut - more resources