This is a preprint.
Assessing Attentiveness and Cognitive Engagement across Tasks using Video-based Action Understanding in Non-Human Primates
- PMID: 40501819
- PMCID: PMC12157403
- DOI: 10.1101/2025.05.31.657183
Assessing Attentiveness and Cognitive Engagement across Tasks using Video-based Action Understanding in Non-Human Primates
Abstract
Background: Distractibility and attentiveness are cognitive states that are expressed through observable behavior. The effective use of behavior observed in videos to diagnose periods of distractibility and attentiveness is still not well understood. Video-based tools for classifying cognitive states from behavior have high potential to serve as versatile diagnostic indicators of maladaptive cognition.
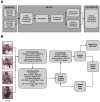
New method: We describe an analysis pipeline that classifies cognitive states using a 2-camera set-up for video-based estimation of attentiveness and screen engagement in nonhuman primates performing cognitive tasks. The procedure reconstructs 3D poses from 2D labeled DeepLabCut videos, reconstructs the head/yaw orientation relative to a task screen, and arm/hand/wrist engagements with task objects, to segment behavior into an attentiveness and engagement score.
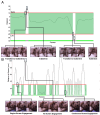
Results: Performance of different cognitive tasks were robustly classified from video within a few frames, reaching >90% decoding accuracy with ≤3min time segments. The analysis procedure allows setting subject-specific thresholds for segmenting subject specific movements for a time-resolved scoring of attentiveness and screen engagement.
Comparison with existing methods: Current methods also extract poses and segment action units; however, they haven't been combined into a framework that enables subject-adjusted thresholding for specific task contexts. This integration is needed for inferring cognitive state variables and differentiating performance across various tasks.
Conclusion: The proposed method integrates video segmentation, scoring of attentiveness and screen engagement, and classification of task performance at high temporal resolution. This integrated framework provides a tool for assessing attention functions from video.
Figures


Similar articles
-
Assessing the comparative effects of interventions in COPD: a tutorial on network meta-analysis for clinicians.Respir Res. 2024 Dec 21;25(1):438. doi: 10.1186/s12931-024-03056-x. Respir Res. 2024. PMID: 39709425 Free PMC article. Review.
-
Cost-effectiveness of using prognostic information to select women with breast cancer for adjuvant systemic therapy.Health Technol Assess. 2006 Sep;10(34):iii-iv, ix-xi, 1-204. doi: 10.3310/hta10340. Health Technol Assess. 2006. PMID: 16959170
-
Education support services for improving school engagement and academic performance of children and adolescents with a chronic health condition.Cochrane Database Syst Rev. 2023 Feb 8;2(2):CD011538. doi: 10.1002/14651858.CD011538.pub2. Cochrane Database Syst Rev. 2023. PMID: 36752365 Free PMC article.
-
A rapid and systematic review of the clinical effectiveness and cost-effectiveness of paclitaxel, docetaxel, gemcitabine and vinorelbine in non-small-cell lung cancer.Health Technol Assess. 2001;5(32):1-195. doi: 10.3310/hta5320. Health Technol Assess. 2001. PMID: 12065068
-
Interventions for providers to promote a patient-centred approach in clinical consultations.Cochrane Database Syst Rev. 2012 Dec 12;12(12):CD003267. doi: 10.1002/14651858.CD003267.pub2. Cochrane Database Syst Rev. 2012. PMID: 23235595 Free PMC article.
References
-
- Azimi M, Oemisch M, Womelsdorf T (2020) Dissociation of nicotinic alpha7 and alpha4/beta2 sub-receptor agonists for enhancing learning and attentional filtering in nonhuman primates. Psychopharmacology (Berl) 237:997–1010. - PubMed
-
- Breiman L (2001) Random Forests. Machine Learning 45:5–32.
Publication types
Grants and funding
LinkOut - more resources
Full Text Sources
