[Preprint]. 2025 May 31:2025.05.27.656408.
doi: 10.1101/2025.05.27.656408.

Loss of tumor suppressor p53 upregulates stem cell factor SOX9 via Notch signaling

Affiliations

Loss of tumor suppressor p53 upregulates stem cell factor SOX9 via Notch signaling

Rahul Sanawar et al. bioRxiv. .

Abstract

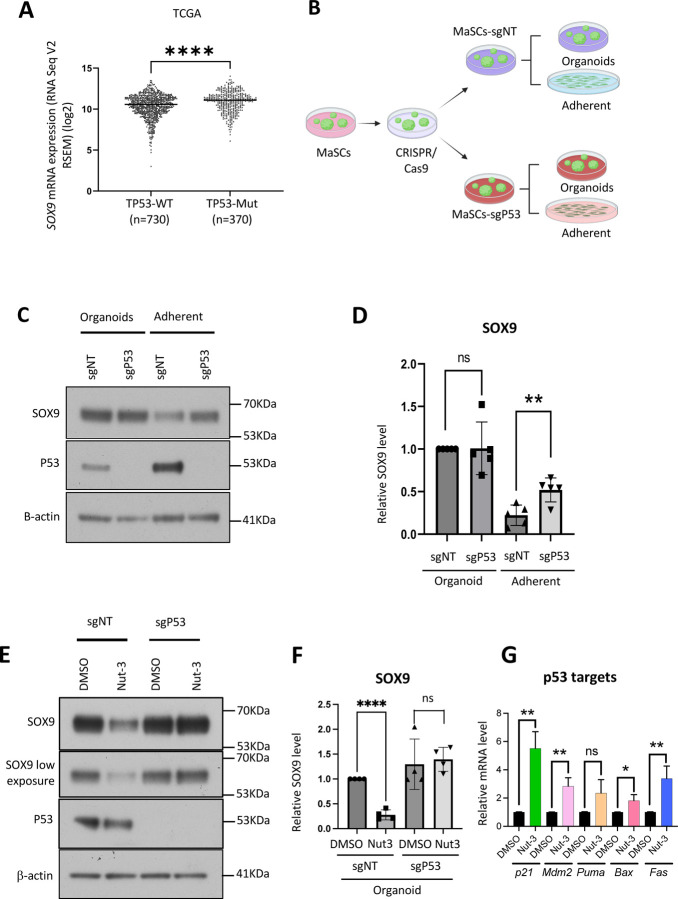
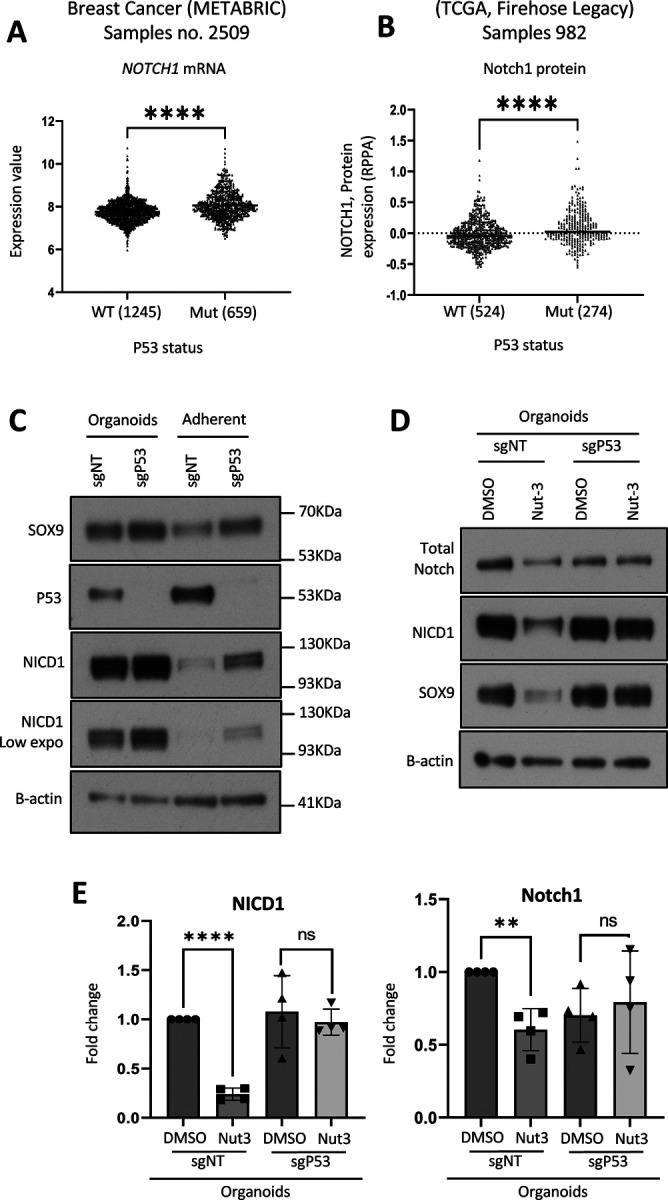
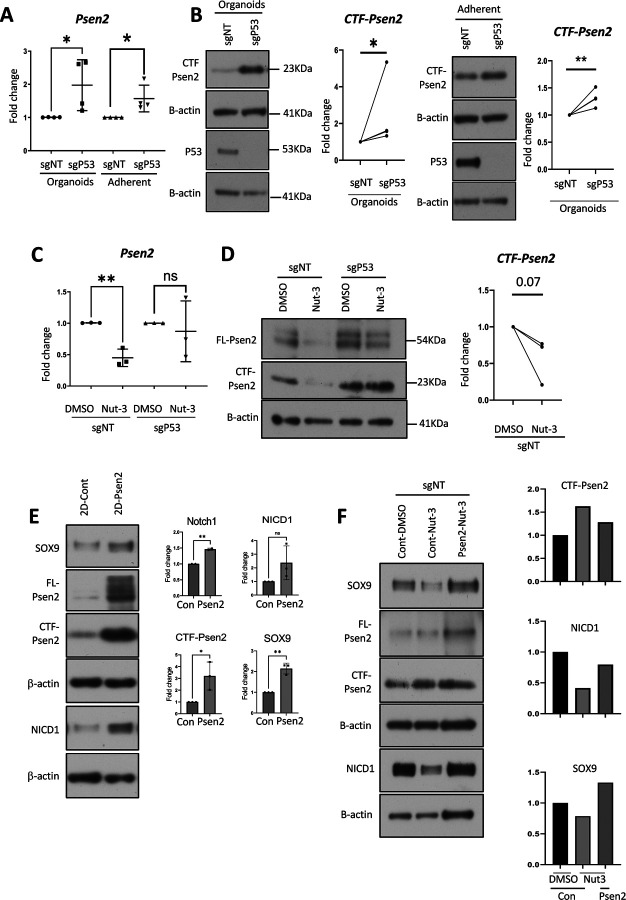
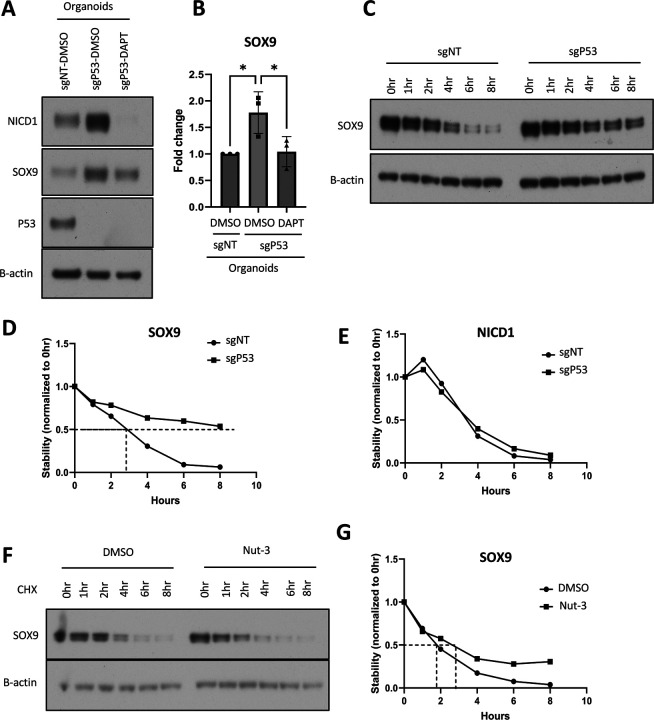
Basal-like breast cancer (BLBC) consists of the majority of triple-negative breast cancer subtype that has a higher degree of cellular plasticity owing to a greater number of stem-like cancer cells compared to other subtypes1. BLBCs are thought to originate from the luminal progenitor cells despite their prominent basal-cell features. SOX9 is a key transcription factor which is expressed selectively in estrogen receptor-negative luminal progenitors in postnatal mammary glands. During BLBC progression, SOX9 upregulation is required for the de-differentiation of luminal cells to multipotent fetal mammary stem cell-like states, which are crucial for the malignant progression of BLBC. However, the mechanism driving SOX9 upregulation in BLBC remains unclear. Since p53 is mutated in nearly 90% of the BLBC and is considered as an early event in the BLBC transformation, we hypothesized that p53 loss could contribute to SOX9 upregulation during BLBC progression. Using primary mammary cell organoids, we showed that p53 loss not only induced the SOX9 expression but also stabilized the half-life of SOX9 protein. We further identified that p53 loss increased Psen2 expression to activate the Notch1 signaling, which induced SOX9 expression. Together, our work identified a molecular mechanism allowing loss of tumor suppressor p53 to coopt the cell fate determinant SOX9 to drive de-differentiation in BLBC.


Conflict of interest statement

Declaration of Interests The authors declare no competing interests.

Figures

Figure 1.
Figure 1.. Loss of p53 upregulates SOX9 expression
A. Scatter plots showing the SOX9 mRNA levels among patients stratified into two groups based on the p53 status. Analysis performed on the TCGA dataset (Firehose Legacy, n=982). B. Schematic diagram of the p53 KO experimental flow. The p53-WT and p53-KO MaSCs were grown in adherent condition or organoid condition for 3.5 days before harvesting the cells for RNA or protein isolation. C. WB analysis of p53 and SOX9 in the organoids proficient or deficient for p53. Organoids were cultured in poly-HEMA coated plates in organoid media or in TC coated normal 60mm culture dishes in organoid media without Matrigel for adherent condition (2D). For 3D culture, 300K cells/well of poly-HEMA coated plates were seeded whereas for 2D culture, 150K cells were seeded in 60mm dishes. MaSCs were grown for 3.5 days before isolating proteins and WB. D. Summarized result of the five experiments used for WB in Fig 5C. E. WB analysis measuring the effect of p53 upregulation by Nut-3 on SOX9 expression. p53-WT and p53-KO organoids were treated with DMSO (as control) or 10uM Nut-3 for 48hrs (n=5) in organoid culture condition. 400K MaSCs were admixed with 2ml organoid media with a final conc. of 10uM Nut-3 and 5% Matrigel and seeded in one well of poly-HEMA coated 6-well plates. After 48hrs of treatment, organoids were analyzed by WB. F. Summarized result of four experiments used for WB in Fig 1E. G. RT-qPCR measuring the effect of Nut-3 treatment on p53 downstream targets.
Figure 2.
Figure 2.. NOTCH signaling upregulates SOX9.
A) WB analysis showing the effect of Notch signaling inhibition on SOX9. Organoids were treated with 10uM DAPT for 72 hrs (n = 3 experiments). B) RT-qPCR analysis showing the effect of Notch signaling inhibition on downstream targets and SOX9. MaSCs derived organoids were treated the same way as for (A) above (n=2 experiments). C) WB analysis showing the effect of NICD1 overexpression on SOX9 in MCF-7 cells (representative results of 4 experiments). D) RT-qPCR analysis showing the effect of NICD1 overexpression on SOX9 and a downstream target, Hey1 (representative results of 4 experiments). E) WB analysis showing the effect of NICD1 overexpression on SOX9 in TNBC cell lines, MDA-MB-231, MDA-MB-436 and SUM159 (representative results of 3 experiments). F) RT-qPCR analysis showing the effect of NICD1 overexpression on downstream targets and SOX9 in TNBC cell lines (representative results of 2 experiments).
Figure 3.
Figure 3.. Loss of p53 activates the Notch signaling
A) Scatter plots showing the expression of NOTCH1 mRNA among patients categorized into two groups based on the TP53 status. Analysis performed on METABRIC (n=2509) dataset. B) Scatter plots showing expression of NOTCH1 protein among patients categorized into two groups based on the TP53 status. Analysis performed on TCGA (n=982) dataset. C) WB analysis showing the effect of p53 KO on NICD1 and SOX9 (n=6). Organoids were cultured in organoid condition (3D) and adherent condition (2D) in same media with and without 5% Matrigel, respectively. For 3D culture, 300K cells/well of poly-HEMA coated plates were seeded whereas for 2D culture, 150K cells were seeded in 600mm dishes. MaSCs were grown for 3.5 days before isolating proteins and WB. D) WB analysis showing the effect of p53 activation by Nut-3 treatment on NICD1 and SOX9. MaSC organoids were treated with DMSO or 10uM Nut-3 for 48hrs. E) Quantification of the Notch and NICD1 WB results shown in Fig 3D (n = 4 experiments).
Figure 4.
Figure 4.. Loss of p53 activates Notch signaling via upregulating Psen2
A. RT-qPCR analysis of Psen2 in the p53-WT and p53-KO organoids (n=4 experiments). B. WB analysis of Psen2 in the p53-WT and p53-KO organoids (n=3 experiments). CTF-Psen2 refers to the C-terminal fragment of Psen2. The graphs show the summarized results of three experiments. C. RT-qPCR analysis of Psen2 upon p53 activation by Nut-3 treatment in sgNT and sgP53 organoids (n=3 experiments). p53-WT and p53-KO organoids were treated with DMSO and 10uM Nut-3 for 72hrs in organoid culture condition. After 72hrs of treatment, organoids were collected, pelleted and lysed in RNA lysis buffer and isolated RNA was used for RT-PCR. D. WB analysis of Psen2 upon p53 activation by Nut-3 treatment in sgNT and sgP53 organoids (n=3). p53-WT and p53-KO organoids were treated with DMSO and 10uM Nut-3 for 72hrs in organoid culture condition. FL-Psen2 refers to full length Psen2 protein whereas CTF-Psen2 refers to C-terminal fragment of Psen2. Figure 3D and 4D share the same β-actin control blot. Right panel shows the summarized results of three experiments. E. WB analysis showing the effect of Psen2 overexpression on SOX9 in p53-WT organoids (one of two repeats was shown). Organoid cells were grown for 3.5 days in adherent condition, then processed for WB. Right panel shows the quantified CTF-Psen2, SOX9 and NICD1 bands in 2 or 3 experiments. F. WB analysis showing the effect of Nut-3 on SOX9, NICD1 and Psen2 in control and Psen2-overexpressing organoids. Right panel shows the quantified CTF-Psen2, SOX9 and NICD1 bands.
Figure 5.
Figure 5.. Loss of p53 increases SOX9 protein stability
A) WB showing the effect of DAPT treatment on NICD1 and SOX9 in the sgP53 organoids. 1×10^6 sgP53 organoids were treated with 10uM DAPT or DMSO for 72hrs in organoid culture condition. sgNT organoids treated with DMSO were used as a control. B) Summarized result of SOX9 WB in (A) (n = 3 experiments). C) WB result showing the increased stability of SOX9 in p53-KO organoids. sgNT and sgP53 organoids were treated with 50ug/ml cycloheximide, and the proteins were isolated at different time points and measured for SOX9 by WB. D) Quantification of the SOX9 WB in (C). Stability curve showing the half-life of SOX9 increases more than 2-fold upon p53 loss (representative result of 4 experiments). E) Effect of P53 loss on the stability of NICD1 at different time points. P53 loss does not significantly impact NICD1 stability. F) WB result showing the stability of SOX9 decreases upon p53 activation by Nut-3 treatment. 600K p53-WT organoid cells were treated with DMSO or Nut-3 (10uM) for 48hrs followed by no or added with cycloheximide (50ug/ml) and cultured in organoid condition. Proteins were isolated at different time points and ran in gel. G) Stability curve showing the half-life of SOX9 decreases upon p53 activation by Nut-3 treatment.

Similar articles

References

    1. Park S.Y., Choi J.H. & Nam J.S. Targeting Cancer Stem Cells in Triple-Negative Breast Cancer. Cancers (Basel) 11 (2019). - PMC - PubMed
    1. Visvader J.E. & Stingl J. Mammary stem cells and the differentiation hierarchy: current status and perspectives. Genes Dev 28, 1143–1158 (2014). - PMC - PubMed
    1. Van Keymeulen A. et al. Distinct stem cells contribute to mammary gland development and maintenance. Nature 479, 189–193 (2011). - PubMed
    1. Wuidart A. et al. Early lineage segregation of multipotent embryonic mammary gland progenitors. Nat Cell Biol 20, 666–676 (2018). - PMC - PubMed
    1. Lilja A.M. et al. Clonal analysis of Notch1-expressing cells reveals the existence of unipotent stem cells that retain long-term plasticity in the embryonic mammary gland. Nat Cell Biol 20, 677–687 (2018). - PMC - PubMed

Publication types