[Preprint]. 2025 May 26:2025.05.25.656000.
doi: 10.1101/2025.05.25.656000.

TRPV4 modulates substrate stiffness mechanosensing and transcellular pore formation in human Schlemm's canal cells

Affiliations

TRPV4 modulates substrate stiffness mechanosensing and transcellular pore formation in human Schlemm's canal cells

Haiyan Li et al. bioRxiv. .

Abstract

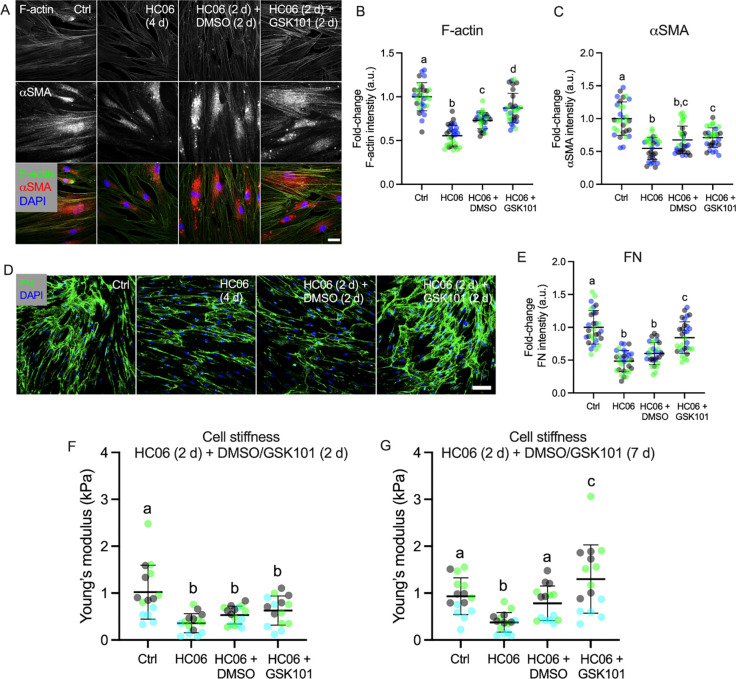
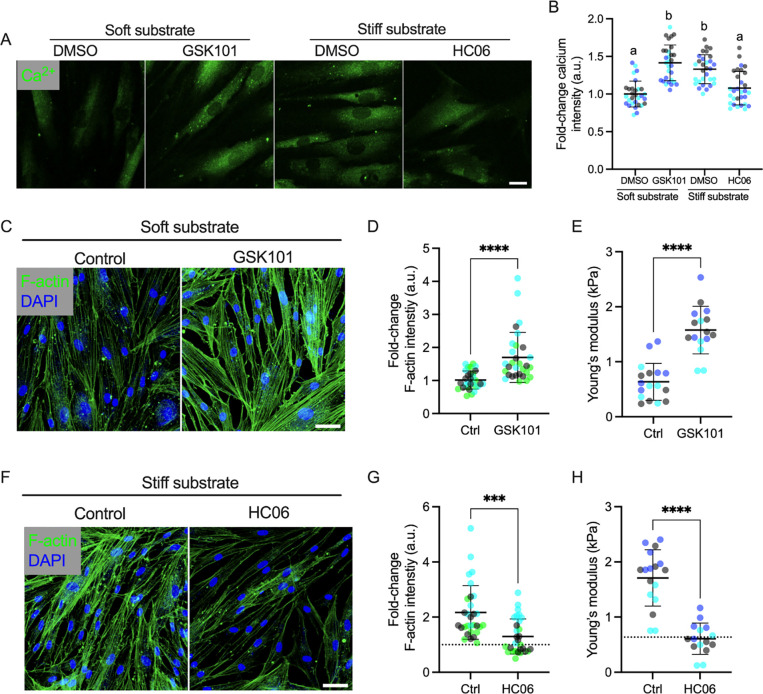
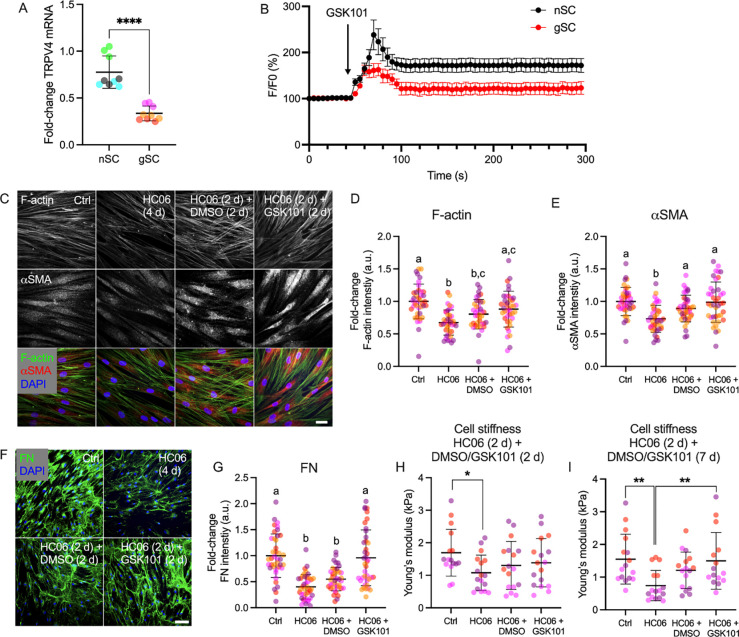
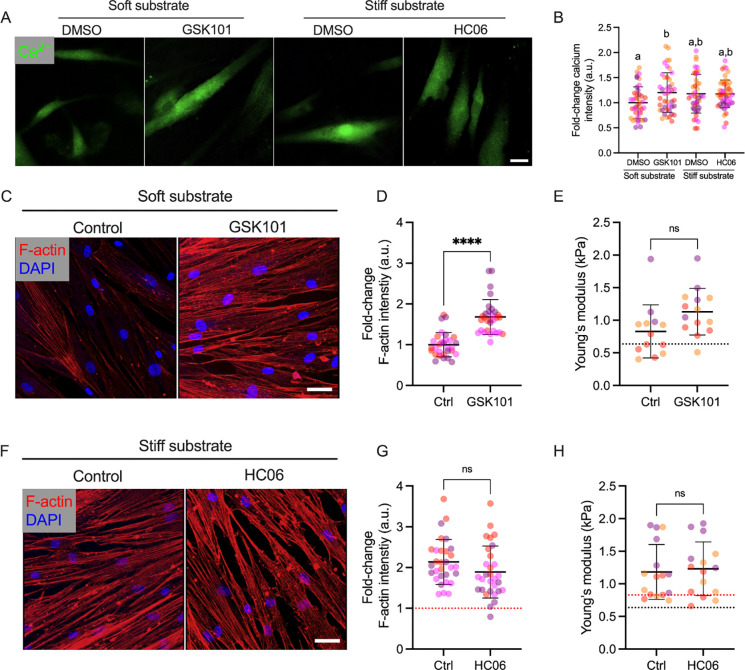
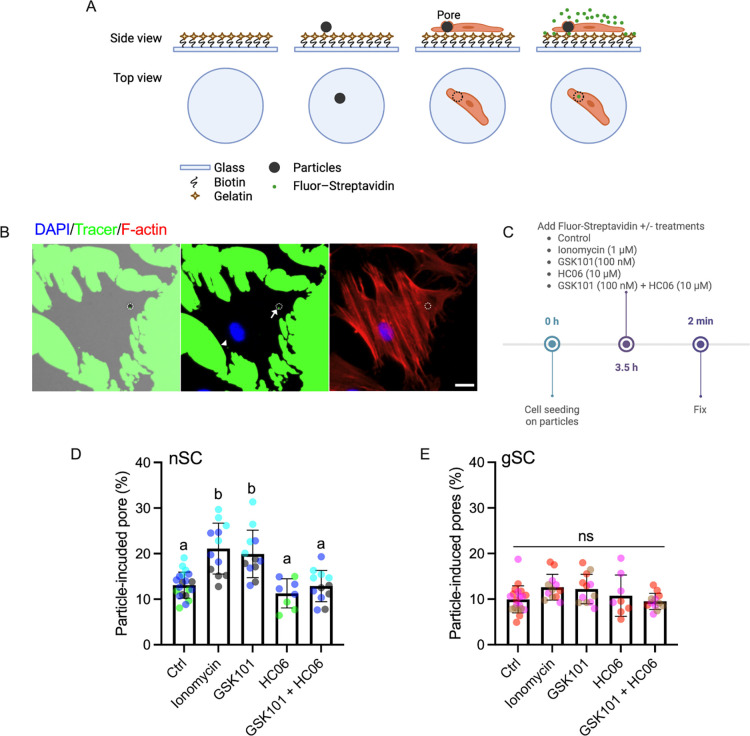
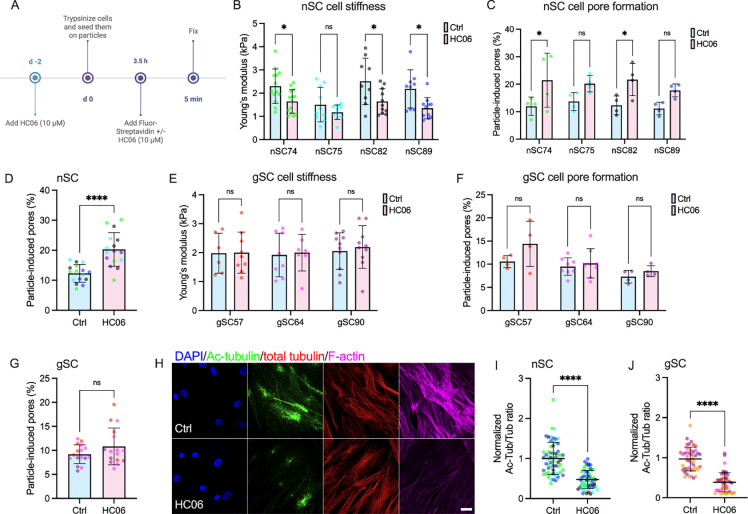
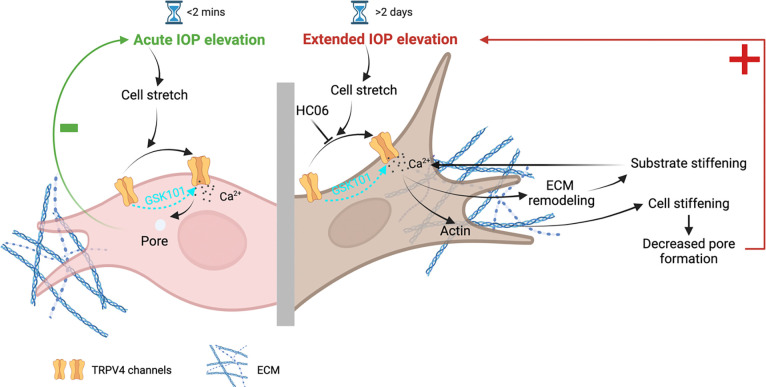
Pathological changes in the biomechanical environment of Schlemm's canal (SC) inner wall cells, such as substrate stiffening and increased cellular stretch, are associated with ocular hypertension, a key risk factor for the development of glaucoma. Cell membrane stretch can trigger the activation of transient receptor potential vanilloid 4 (TRPV4) mechanosensitive ion channels, allowing calcium influx and initiating downstream signaling. However, the precise role of TRPV4 in SC cell mechanobiology remains unclear. Here, we demonstrate that sustained inhibition of TRPV4 activity modulates substrate stiffness mechanosensing to thereby affect the remodeling of the actin cytoskeleton and extracellular matrix of SC cells. This is accompanied by a reduction in cell stiffness and an increase in transcellular pore forming ability, potentially lowing outflow resistance and risk of ocular hypertension. Conversely, acute activation of TRPV4 channels induces Ca2+ influx, increasing transcellular pore formation in SC cells. Notaly, reduced TRPV4 mechanosensing was observed in glaucomatous SC cells, resulting in reduced transcellular pore forming ability. These findings suggest novel potential strategies based on targeting TRPV4 in SC cells for the treatment of ocular hypertension in glaucoma.

Keywords: ECM stiffening; Glaucoma; calcium signaling; hydrogel; ion channel; mechanobiology; tissue engineering; trancellular pore.


Conflict of interest statement

Disclosure The authors report no conflicts of interest.

Figures

Fig. 1.
Fig. 1.. TRPV4-mediated mechanobiological response in normal Schlemm’s canal (nSC) cells.
(A) Representative fluorescence micrographs of F-actin and αSMA in nSC cells under the following conditions: control (DMSO); exposure to the TRPV4 antagonist HC06 (10 μM) for 4 days; exposure to the TRPV4 antagonist HC06 (10 μM) for 2 days, followed by removal of HC06 and exposure to vehicle (DMSO) for 2 days; and exposure to the TRPV4 inhibitor HC06 (10 μM) for 2 days followed by removal of HC06 and exposure to the TRPV4 agonist GSK101 (100 nM) for 2 days. Scale bar, 20 μm. (B, C) Plots of F-actin and αSMA normalized protein labelling intensity (n = 30 images per group from 3 nSC cell strains with three replicates per cell strain). (D) Representative fluorescence micrographs showing fibronectin (FN) expression and deposition by nSC cells. Scale bar, 100 μm. (E) Analysis of FN protein labelling intensity (n = 30 images per group from 3 nSC cell strains with three replicates per cell strain). (F) Young’s modulus of nSC cells measured by AFM, with groups as in panel A (n = 15 cells per group from 3 nSC cell strains). (G) Young’s modulus of nSC cells with groups as in panel A, except that exposure to DMSO or GSK101 was for 7 days instead of 2 days (n = 15 cells per group from 3 nSC cell strains). Symbols with the same colors are from the same cell strains. Lines and error bars indicate mean ± SD. Significance was determined by two-way ANOVA using multiple comparisons tests [shared significance indicator letters represent non-significant difference (p > 0.05), distinct letters represent significant difference (p < 0.05)].
Fig. 2.
Fig. 2.. TRPV4 activity in nSC cells affects their response to substrate stiffness.
(A) Representative fluorescence micrographs of intracellular Ca2+ in Fluo-4AM-labeled nSC cells on the soft and stiff hydrogel substrates under control (DMSO) conditions, or treated with the TRPV4 agonist GSK101 (100 nM) or antagonist HC06 (10 μM) for 2 days. Scale bars, 20 μm. (B) Plots of normalized intracellular Ca2+ fluorescence intensity (n = 10 images per group from 3 nSC cell strains). (C) Representative fluorescence micrographs of F-actin in nSC cells on the soft substrate grown for 2 days in either control (DMSO) conditions, or with the TRPV4 agonist GSK101 (100 nM) added to the media. Scale bar, 20 μm. (D, E) Plots of F-actin fluorescent intensity and Young’s modulus measured by AFM in nSC cells exposed to control media or the TRPV4 agonist GSK101 for 2 days (100 nM; F-actin: n = 30 images per group from 3 nSC cell strains with three replicates per cell strain; AFM: n = 16–17 cells per group from 3 nSC cell strains). (F) Representative fluorescence micrographs of F-actin in nSC cells grown on the stiff substrate for 2 days in either control (DMSO) conditions, or with the TRPV4 antagonist HC06 (10 μM) added to the media. Scale bar, 20 μm. (G, H) Similar to panels (D, E), except that cell were grown on the stiff substrate and treated with a TRPV4 antagonist for 2 days. Symbols with the same colors are from the same cell strains. The lines and error bars indicate mean ± SD; dotted lines show the control mean values obtained from nSC cell grown on the soft substrate, for reference. Significance was determined by two-way ANOVA using multiple comparisons tests (***p<0.001, ****p<0.0001).
Fig. 3.
Fig. 3.. Responses of glaucomatous SC (gSC) cells toTRPV4 modulation.
(A) Normalized TRPV4 mRNA levels in normal (nSC) and glaucomatous (gSC) SC cells, determined by qRT-PCR (normalization to GAPDH levels; n = 9 replicates from 3 nSC/3 gSC cell strains). (B) Relative fluorescence intensities (F/F0) of the calcium indicator Fluo-4AM in nSC and gSC cells in response to the TRPV4 agonist GSK101 (100 nM; n = 12 replicates from 3 nSC cell strains, n = 4 replicates from 2 gSC cell strains). (C) Representative fluorescence micrographs of F-actin and αSMA in gSC cells under the following conditions: control (DMSO); exposure to the TRPV4 antagonist HC06 (10 μM) for 4 days; exposure to the TRPV4 antagonist HC06 (10 μM) for 2 days, followed by removal of HC06 and exposure to vehicle (DMSO) for 2 days; and exposure to the TRPV4 inhibitor HC06 (10 μM) for 2 days followed by removal of HC06 and exposure to the TRPV4 agonist GSK101 (100 nM) for 2 days. Scale bar, 20 μm. (D, E) Plots of F-actin and αSMA fluorescent labeling intensities (n = 40 images per group from 4 gSC cell strains with three replicates per cell strain). (F) Representative fluorescence micrographs of fibronectin (FN) in gSC cells cultured under various conditions as in panel A. Scale bar, 100 μm. (G) Plots of FN fluorescence intensity (n = 40 images per group from 4 gSC cell strains with three replicates per cell strain). (H, I) Young’s modulus of gSC cells measured by AFM with either 2 (panel H; n = 16–17 cells per group from gSC cell strains) or 7 days treatment with TRPV4 agonist (panel I; n = 15–16 cells per group from 3 gSC cell strains). Symbols with the same colors are from the same cell strains. The lines and error bars indicate mean ± SD. Significance was determined by two-way ANOVA using multiple comparisons tests [*p<0.05, **p<0.01, shared significance indicator letters represent non-significant difference (p > 0.05), distinct letters represent significant difference (p < 0.05)].
Fig. 4.
Fig. 4.. Impaired TRPV4-modulated substrate stiffness mechanosensing in gSC cells.
(A) Representative fluorescence imaging of intracellular Ca2+ in Fluo-4AM-labeled gSC cells cultured on the soft and stiff hydrogel substrates, under control conditions or after modulation of TRPV4 activity for 2 days. Scale bars, 20 μm. (B) Plots of normalized intracellular Ca2+ fluorescence intensity corresponding to conditions shown in panel A (n = 40 images per group from 4 gSC cell strains with three replicates per cell strain). (C) Representative fluorescence micrographs of F-actin in gSC cells on the soft substrate grown for 2 days in either control (DMSO) conditions, or with the TRPV4 agonist GSK101 (100 nM) added to the media. Scale bar, 20 μm. (D, E) Plots of F-actin fluorescent intensity and Young’s modulus measured by AFM in gSC cells exposed to control media or the TRPV4 agonist GSK101 for 2 days (100 nM; F-actin: n = 30 images per group from 3 gSC cell strains with three replicates per cell strain; AFM: n = 16–17 cells per group from 3 gSC cell strains). (F) Representative fluorescence micrographs of F-actin in gSC cells grown on the stiff substrate for 2 days in either control (DMSO) conditions, or with TRPV4 antagonist HC06 (10 μM) added to the media. Scale bar, 20 μm. (G, H) Plots of F-actin fluorescent intensity and Young’s modulus measured by AFM in gSC cells exposed to control media or the TRPV4 antagonist HC06 for 2 days (10 μM; F-actin: n = 30 images per group from 3 gSC cell strains with three replicates per cell strain; AFM: n = 15–17 cells per group from 3 gSC cell strains). Symbols with different colors represent different cell strains. The lines and error bars indicate Mean ± SD; black and red dotted lines show nSC and gSC cell on the soft substrate control mean value for reference. Significance was determined by two-way ANOVA using multiple comparisons tests (****p<0.0001).
Fig. 5.
Fig. 5.. Rapid TRPV4 activation induces upregulation of intracellular Ca2+ and enhances trancellular pore formation in SC cells.
(A) Schematic showing particles for inducing, and fluorescence assay for detecting, pores in SC cells. Carboxyl particles (4.0–4.9 μm diameter) were seeded on a biotinylated gelatin substrate, followed by plating of normal or glaucomatous SC cells. Subsequently, fluorescently-tagged streptavidin was introduced into the culture media. (B) Representative fluorescent micrographs showing spots where fluorescently tagged streptavidin (green) has bound with biotin substrate under cultured SC cells (at sites of intracellular pores) as well as surrounding regions not covered by cells. White circles outline particles. The arrow indicates a particle-induced pore, while the arrowhead points to a spontaneously formed pore detected by the fluorescent assay but not associated with a particle. Scale bar: 50 μm. (C) Schematic showing the time course of pore formation assay: SC cells were seeded atop particles on a biotinylated gelatin-coated glass substrate. Three and half hours after cell seeding, fluorescently-tagged streptavidin plus the relevant treatment (DMSO [control], 1 μM ionomycin, 100 nM GSK101, 10 μM HC06, or co-treatment with 10 μM HC06 plus 100 nM GSK101) was introduced into the culture media and incubated for 2 mins. Created with BioRender.com. (D) Pore incidence (percentage of particles associated with pores) in nSC cells (n = 4 wells per nSC cell strain). (E) Pore incidence in gSC cells (n = 4 wells per gSC cell strain). Symbols with different colors represent different cell strains. The lines and error bars indicate Mean ± SD. Significance was determined by two-way ANOVA using multiple comparisons tests [shared significance indicator letters represent non-significant difference (p > 0.05), distinct letters represent significant difference (p < 0.05)].
Fig. 6.
Fig. 6.. Impact of prolonged TRPV4 inhibition on stiffness, trancellular pore formation, and MTs in SC cells.
(A) Schematic illustrating the pore formation assay timeline: SC cells were treated with 10 μM HC06 in medium containing 10% FBS for 2 days, followed by trypsinization and plating on particles to induce pore formation. Cells were allowed to spread for 3.5 hours under either control (DMSO) conditions, or with the TRPV4 antagonist HC06 (10 μM) added to the media, and transcellular pore formation was detected using fluorescently-tagged streptavidin. Created with BioRender.com. (B, E) Young’s modulus of nSC and gSC cells measured by AFM (nSC cell: n = 9–14 cells per group; gSC cell: n = 6–10 cells per group). (C, F) Pore formation rate (percentage of particles with an associated pore) induced by particles in nSC (n = 4 wells per group) and gSC cells (n = 4–8 wells per group). (D, G) Pooled data on transcellular pore formation rate from all nSC and gSC cell strains. Symbols with different colors represent different cell strains. (H) Representative fluorescence micrographs of F-actin, acetylated α-tubulin (Ac-tubulin), and total α-tubulin in nSC cells treated with DMSO or TRPV4 antagonist HC06 (10 μM). Scale bar, 20 μm. (I, J) Ratio of acetylated to total microtubule fluorescent intensity in normal and gaucomatous SC cells (n = 20 images per group from 2 nSC/gSC cell strains with three replicates per cell strain). Symbols with different colors represent different cell strains. The lines and error bars indicate Mean ± SD. Significance was determined by two-way ANOVA using multiple comparisons tests (*p<0.05, ****p<0.0001).
Figure 7.
Figure 7.. Schematic for hypothesized role of TRPV4 mechanotransduction in SC cells.
Under normal circumstances (left), acute IOP elevation activates TRPV4 channels, inducing Ca2+ influx and transcellular pore formation to facilitate aqueous outflow, thereby decreasing IOP and maintaining homeostasis. However, if IOP is chronically elevated (right), the SC inner wall cell substrate stiffens which induces elevation of intracellular Ca2+, this leads to actin and ECM remodeling, increasing cell stiffness and forming a positive feedback loop that mitigates against IOP homeostasis. Sustained TRPV4 modulation influences SC cell mechanobiology, where inhibition reduces stiffness and increases pore formation, while activation has the opposite effect. The effects of TRPV4 modualtion are diminished in glaucomatous SC cells. Created with BioRender.com.

Similar articles

References

    1. Quigley H.A. (1993). Open-angle glaucoma. N Engl J Med 328, 1097–1106. 10.1056/nejm199304153281507. - DOI - PubMed
    1. Quigley H.A., and Broman A.T. (2006). The number of people with glaucoma worldwide in 2010 and 2020. Br J Ophthalmol 90, 262–267. 10.1136/bjo.2005.081224. - DOI - PMC - PubMed
    1. Tamm E.R., Braunger B.M., and Fuchshofer R. (2015). Intraocular Pressure and the Mechanisms Involved in Resistance of the Aqueous Humor Flow in the Trabecular Meshwork Outflow Pathways. Prog Mol Biol Transl Sci 134, 301–314. 10.1016/bs.pmbts.2015.06.007. - DOI - PubMed
    1. Brubaker R.F. (1991). Flow of aqueous humor in humans [The Friedenwald Lecture]. Invest Ophthalmol Vis Sci 32, 3145–3166. - PubMed
    1. Ashpole N.E., Overby D.R., Ethier C.R., and Stamer W.D. (2014). Shear stress-triggered nitric oxide release from Schlemm’s canal cells. Investigative ophthalmology & visual science 55, 8067–8076. 10.1167/iovs.14-14722. - DOI - PMC - PubMed

Publication types

LinkOut - more resources