[Preprint]. 2025 Jun 6:2025.06.03.657652.
doi: 10.1101/2025.06.03.657652.

Gene therapies alleviate absence epilepsy associated with Scn2a deficiency in DBA/2J mice

Affiliations

Gene therapies alleviate absence epilepsy associated with Scn2a deficiency in DBA/2J mice

Zaiyang Zhang et al. bioRxiv. .

Abstract

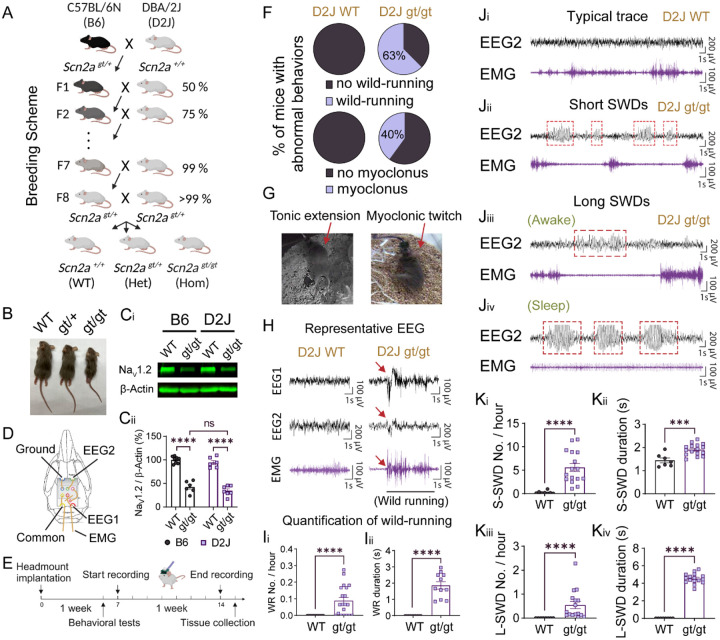
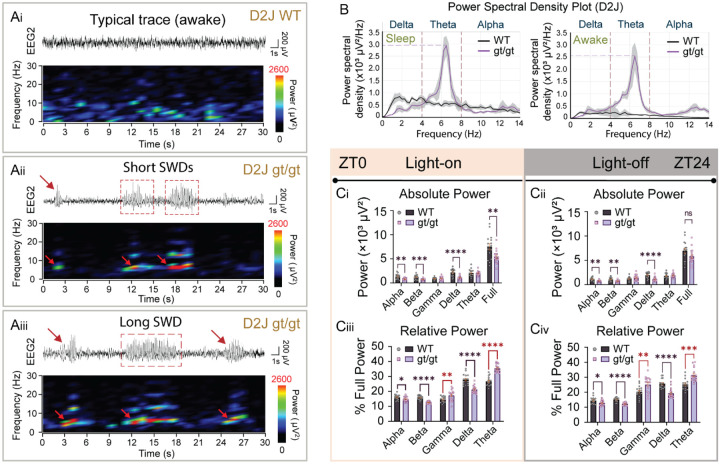
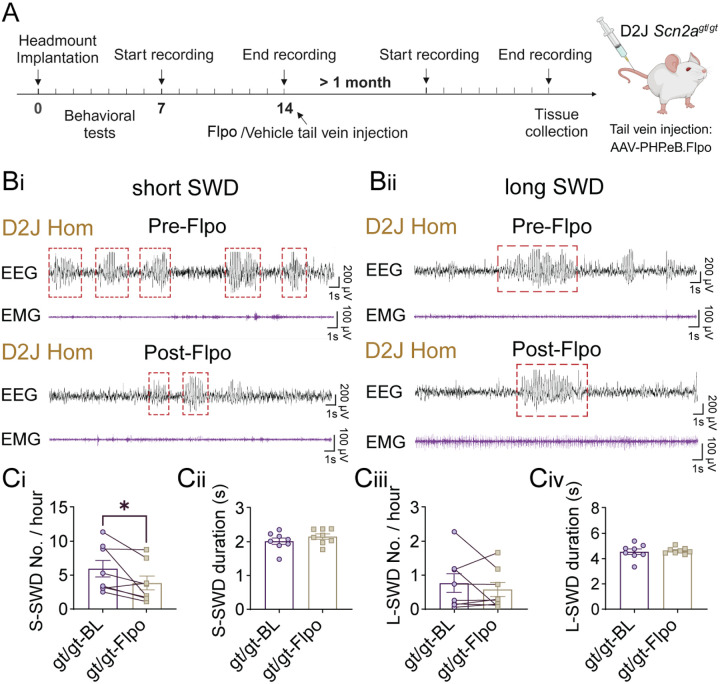
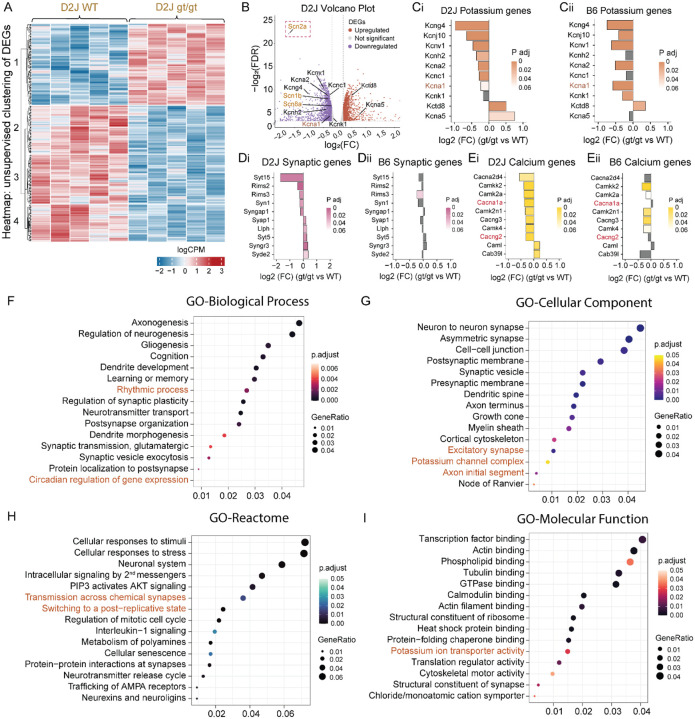
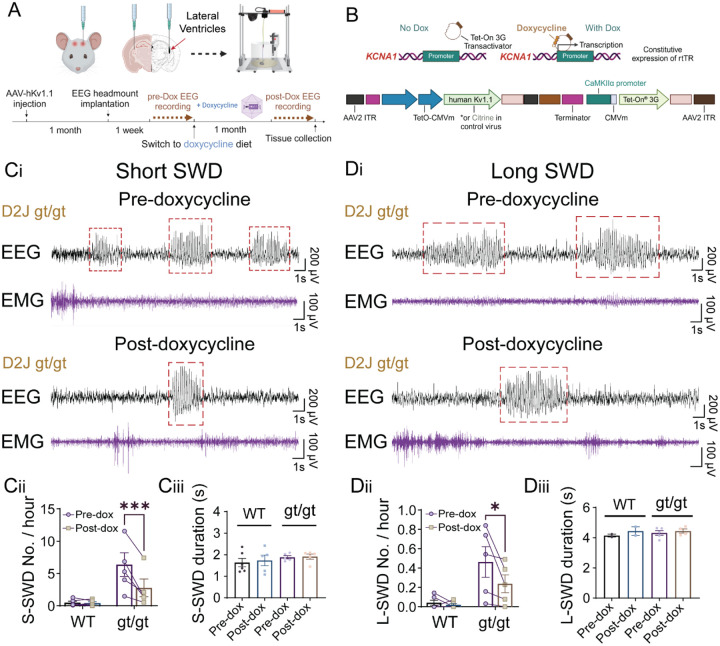
Mutations in the voltage-gated sodium channel gene SCN2A, which encodes the NaV1.2 channel, cause severe epileptic seizures. Patients with SCN2A loss-of-function (LoF) mutations, such as protein-truncating mutations, often experience later-onset and drug-resistant epilepsy, highlighting an urgent unmet clinical need for new therapies. We previously developed a gene-trap Scn2a (Scn2a gt/gt ) mouse model with a global NaV1.2 reduction in the widely used C57BL/6N (B6) strain. Although these mice display multiple behavioral abnormalities, EEG recordings indicated only mild epileptiform discharges, possibly attributable to the seizure-resistant characteristics associated with the B6 strain. To enhance the epileptic phenotype, we derived congenic Scn2a gt/gt mice in the seizure-susceptible DBA/2J (D2J) strain. Notably, we found that these mice exhibit prominent spontaneous absence seizures, marked by both short and long spike-wave discharges (SWDs). Restoring NaV1.2 expression in adult mice substantially reduced their SWDs, suggesting the possibility of SCN2A gene replacement therapy during adulthood. RNA sequencing revealed significant alterations in gene expression in the Scn2a gt/gt mice, in particular a broad downregulation of voltage-gated potassium channel (KV) genes, including KV1.1. The reduction of KV1.1 expression was further validated in human cerebral organoids with SCN2A deficiency, highlighting KV1.1 as a promising therapeutic target for refractory seizures associated with SCN2A dysfunction. Importantly, delivery of exogenous human KV1.1 expression via adeno-associated virus (AAV) in D2J Scn2a gt/gt mice substantially reduced absence seizures. Together, these findings underscore the influence of mouse strain on seizure severity and highlight the potential of targeted gene therapies for treating SCN2A deficiency-related epilepsies.

Keywords: KV1.1; NaV1.2; SCN2A; absence seizure; gene therapy; human brain organoid; mouse strain difference; voltage-gated sodium channel.


Conflict of interest statement

Conflict of interests: The authors have declared that no conflict of interest exists.

Figures

Figure 1.
Figure 1.. Severe deficiency of Scn2a results in spontaneous absence seizures and abnormal behaviors in DBA/2J mice.
(A) The breeding scheme for generating the Scn2a gene-trap congenic mice in the DBA/2J (D2J) background from the C57BL/6N (B6) background. (B) D2J Scn2agt/gt mice have smaller body sizes compared to D2J WT or D2J Het mice. (C) Western blot shows that the NaV1.2 protein expression level in the D2J Scn2agt/gt mice is decreased to a similar level to the B6 Scn2agt/gt mice compared to their corresponding WTs. Results were normalized to the expression of housekeeping protein β-actin. N = 6 for all four groups. (D) A schematic of the prefabricated 2EEG/1EMG headmount from the Pinnacle system. (E) Timeline of the EEG recording experiment. Mice were recovered in their home cage for at least a week before 1-week video-EEG recording. (F) Percentage of D2J Scn2agt/gt mice with wild-running (WR) behavior or myoclonic twitches. (G) Video screenshots show epilepsy-related abnormal behaviors in two D2J Scn2agt/gt mice. (H) Representative EEG1 (posterior) and EEG2 (anterior) signals for a typical WT mouse awake and walking and a Scn2agt/gt D2J mouse during the wild-running episode. Red arrows indicate the start of the wild running event. (I) Quantification of the frequency and duration of the wild-running (WR) behavior for D2J WT and D2J Scn2agt/gt. (J) Representative EEG2 and EMG traces of typical D2J WT mouse with no spike-wave discharges (SWD), D2J Scn2agt/gt mice with short SWDs (S-SWDs), and D2J Scn2agt/gt mice with long SWDs (L-SWDs) which last > 3.5 s during awake or asleep states. (K) Quantifications of the frequency and duration of short and long spike-wave discharges (SWD) in the D2J WT and Scn2agt/gt. Data are presented as mean ± SEM. Statistical analyses: Two-way ANOVA: F (DFn, DFd) = F (1, 23) = 221.8 for the genotype factor and post hoc multiple comparisons with Tukey’s correction (B6 WT vs. Scn2agt/gt and D2J WT vs. Scn2agt/gt) (C). Mann-Whitney U test (Ii, Ki, Kiii, Kiv). Unpaired t-test (Kii). *p < 0.05; **p < 0.01; ***p < 0.001; ****p < 0.0001. Exact p values can be found in Table S1.
Figure 2.
Figure 2.. D2J Scn2agt/gt mice show an overall reduction of absolute power with an increase in relative gamma and theta power
(A) Example EEG traces and corresponding power spectral density heatmaps. (Ai) A typical trace in a D2J WT mouse. (Aii) Two consecutive short spike-wave discharges (S-SWDs) in a D2J Scn2agt/gt mouse. (Aiii) A long SWD accompanied by two S-SWDs (indicated by red arrows) in a D2J Scn2agt/gt mouse. The animals were all in the awake state in these three examples. Note that the baseline EEG voltage is higher in the D2J WT than the D2J Scn2agt/gt across all animals, according to the higher absolute power observed in the D2J WT mice. (B) Power spectral density plot showing examples of different frequency distributions for D2J WT vs. D2J Scn2agt/gt mice during the light-on sleep (left) vs. light-off awake (right) states. Note that Scn2agt/gt mice have high power density in the theta band (4–8Hz), corresponding to the frequency range of SWDs in mice. The maximum power of the theta band is higher during sleep compared to awake. (C) Quantification of absolute and relative power distribution of D2J WT and D2J Scn2agt/gt mice over 1 week recording. Relative power was calculated by dividing the individual frequency band by the full power of that animal. (Ci-Cii) D2J Scn2agt/gt mice have significantly lower absolute power compared to the D2J WT mice, especially in the alpha, beta, and delta frequency bands. (Ciii-Civ) D2J Scn2agt/gt mice have lower relative power in the alpha, beta, and delta bands, but elevation of % power in the gamma and theta bands. Power spectra were calculated for light-on and light-off periods separately by Fast Fourier Transform (FFT) with Hann (cosine-bell) data window set using an epoch of 10 s based on the following frequency bands: full (0–100 Hz), delta (0.5–4 Hz), theta (4–8 Hz), alpha (8–13 Hz), beta (13–30 Hz), and gamma (30–100 Hz). The relative power was calculated by dividing each power band with the full power (0–100 Hz). Data are presented as mean ± SEM. Statistical analyses: Two-way ANOVA: F (DFn, DFd) = F (1, 186) = 29.01 ****p < 0.0001 for the [genotype] factor; Multiple t-test (C1). *p < 0.05; **p < 0.01; ***p < 0.001; ****p < 0.0001. Exact p values can be found in Supplemental Table 1.
Figure 3.
Figure 3.. Severe Scn2a deficiency renders intrinsic hyperexcitability of layer 2/3 pyramidal neurons in the D2J Scn2agt/gt mice
(A) Fluorescence imaging of a pyramidal neuron injected with biocytin after the patch clamp recording. Atlas on the right shows the location of patched cells which was in the superficial layer 2/3 of the somatosensory cortex above caudoputamen. (Bi-Bii) Representative current-clamp recordings of pyramidal neurons from D2J wild-type (WT, black) and homozygotes (Scn2agt/gt) (violet) mice were obtained at the resting membrane potential (RMP). (C) The number of action potentials (APs) generated in response to stepwise increased current pulses was significantly higher in the D2J Scn2agt/gt mice. (D) Pyramidal neurons in D2J Scn2agt/gt mice had significantly higher resting membrane potential (RMP) compared to the D2J WT. (E) Representative traces in response to −100 pA injection in D2J Scn2agt/gt and D2J WT. (F) Pyramidal neurons in D2J Scn2agt/gt mice have significantly higher input resistance compared to D2J WT. (G) Typical AP spikes of pyramidal neurons from D2J WT (black) and Scn2agt/gt (violet) mice were obtained at the normal RMP. (H) Example phase-plane plots show different AP shapes in D2J WT and Scn2agt/gt. (I) The mean spike rheobase (pA) for pyramidal neurons in D2J Scn2agt/gt mice was significantly lower than in D2J WT mice. (J) The mean voltage threshold (mV) was unchanged in D2J Scn2agt/gt vs. WT. (K) The mean AP amplitude (mV) of pyramidal neurons in D2J Scn2agt/gt was significantly decreased compared with D2J WT neurons. (L-M) The mean AP fast after-hyperpolarization (AHP) and half-width value of pyramidal neurons were not changed in D2J Scn2agt/gt. Data are presented as mean ± SEM. Statistical analyses: Two-way ANOVA and unpaired two-tailed non-parametric Mann-Whitney U test for each current pulse (C). Unpaired Student’s t-test was used for all other comparisons (D)(F)(H)(I-M). *p < 0.05; **p < 0.01; ***p < 0.001; ****p < 0.0001. Exact p values can be found in Supplemental Table 1.
Figure 4.
Figure 4.. Genetic restoration of Scn2a expression by tail vein injection of AAV-PHP.eB-Flpo reduced short SWDs in the D2J Scn2agt/gt mice
(A) Schematic timeline of Flpo or control virus injection. D2J Scn2agt/gt mice underwent EEG headmount implantation and recovered in the home cage for one week. One-week continuous video-EEG recordings were conducted pre-Flpo and 1-month post-Flpo tail vein injection. (Bi-Bii) Representative EEG2 traces showing spike-wave discharges (SWDs) in the D2J Scn2agt/gt mice before and after AAV-PHP.eB-Flpo injection. (Ci-Civ) Quantification of EEG data showed that D2J Scn2agt/gt mice had a significant reduction in S-SWD number per hour but no change in S-SWD duration (s) or L-SWD frequency/duration after Flpo injection. Data are presented as mean ± SEM. Statistical analyses: Paired Student’s t-tests were used in all analyses (Ci-Civ)(Ei-Eiv). *p < 0.05; **p < 0.01; ***p < 0.001; ****p < 0.0001.
Figure 5.
Figure 5.. Bulk RNA-seq analyses revealed possible molecular mechanisms underlying the seizure susceptibility in D2J Scn2agt/gt mice including reduced expression of KV channels
(A) Heatmap showing an overall pattern of unsupervised clustering of seizure-related differentially expressed genes (DEGs) in the D2J WT vs. D2J Scn2agt/gt. logCPM: log counts per million. (B) Volcano plot showing the –log2(FDR) and log2(FC) of voltage-gated sodium and potassium channels in D2J WT vs. D2J Scn2agt/gt cortices. Note that the Scn2a gene was significantly downregulated as expected (red dashed box). (C-E) Side-by-side comparison of potassium channel genes, synaptic associated genes, and calcium channel genes that were significantly downregulated in the D2J Scn2agt/gt mice with the same gene changes in the B6 based on previous study. (F-I) Gene ontology analyses based on the biological process, cellular component, Reactome, and molecular function of the D2J Scn2agt/gt mice compared to D2J WT mice. FDR: False discovery rate; FC: Fold change. Data are presented as mean ± SEM. Statistical analyses: Please refer to the methods section for specific statistical analysis used for the bulk RNA seq data. Multiple hypothesis testing correction was done using the Benjamini-Hochberg method, with genes showing an FDR below 0.1 considered differentially expressed. Exact p values can be found in Supplemental Table 1.
Figure 6.
Figure 6.. Overexpression of human KV1.1 in the D2J Scn2agt/gt mice reduced the frequency of both short and long SWDs related to absence seizures
(A) Schematic of the AAV-hKV1.1 virus injection experiment and video-EEG recording timeline. (B) Construct of the AAV-hKV1.1 virus showing the addition of doxycycline activating the genetic expression under a Tet-On system. (Ci-iii) Example EEG traces and quantifications showing a significant reduction in SWD frequency for D2J Scn2agt/gt after doxycycline induction of the AAV-hKV1.1 virus expression. The duration of SWDs was unchanged. (Di-iii) Example EEG traces and quantifications showing a significant reduction in absence seizures frequency for D2J Scn2agt/gt after doxycycline induction of the AAV-hKV1.1 virus expression. The duration of absence seizures was unchanged. Data are presented as mean ± SEM. Statistical analysis: Paired Student’s t-tests were used in all analyses (Cii-Ciii)(Dii-Diii). *p < 0.05; **p < 0.01; ***p < 0.001; ****p < 0.0001. Exact p values can be found in Supplemental Table 1.

Similar articles

References

    1. Collaborators GUND, Feigin VL, Vos T, Alahdab F, Amit AML, Barnighausen TW, et al. Burden of Neurological Disorders Across the US From 1990–2017: A Global Burden of Disease Study. JAMA Neurol. 2021;78(2):165–76. - PMC - PubMed
    1. Hildebrand MS, Dahl HHM, Damiano JA, Smith RJH, Scheffer IE, and Berkovic SF. Recent advances in the molecular genetics of epilepsy. Journal of Medical Genetics. 2013;50(5):271–9. - PubMed
    1. Guerrini R, Conti V, Mantegazza M, Balestrini S, Galanopoulou AS, and Benfenati F. Developmental and epileptic encephalopathies: from genetic heterogeneity to phenotypic continuum. Physiol Rev. 2023;103(1):433–513. - PMC - PubMed
    1. Heyne HO, Artomov M, Battke F, Bianchini C, Smith DR, Liebmann N, et al. Targeted gene sequencing in 6994 individuals with neurodevelopmental disorder with epilepsy. Genet Med. 2019;21(11):2496–503. - PubMed
    1. Berg AT, Thompson CH, Myers LS, Anderson E, Evans L, Kaiser AJE, et al. Expanded clinical phenotype spectrum correlates with variant function in SCN2A-related disorders. Brain: a journal of neurology. 2024. - PMC - PubMed

Publication types

LinkOut - more resources