[Preprint]. 2025 Jun 6:2025.06.02.657435.
doi: 10.1101/2025.06.02.657435.

The Neurofibrillary Tangle Maturity Scale: A Novel Framework for Tangle Pathology Evaluation in Alzheimer's Disease

Affiliations

The Neurofibrillary Tangle Maturity Scale: A Novel Framework for Tangle Pathology Evaluation in Alzheimer's Disease

Christina M Moloney et al. bioRxiv. .

Abstract

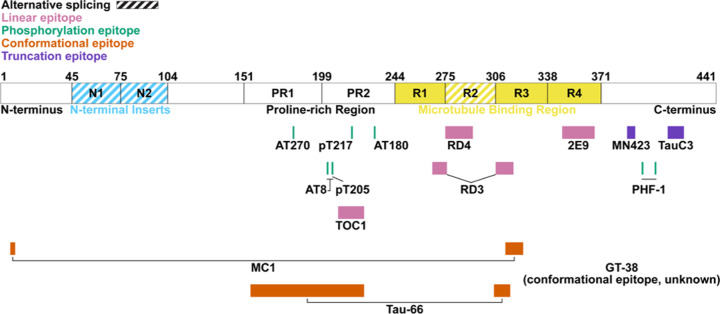
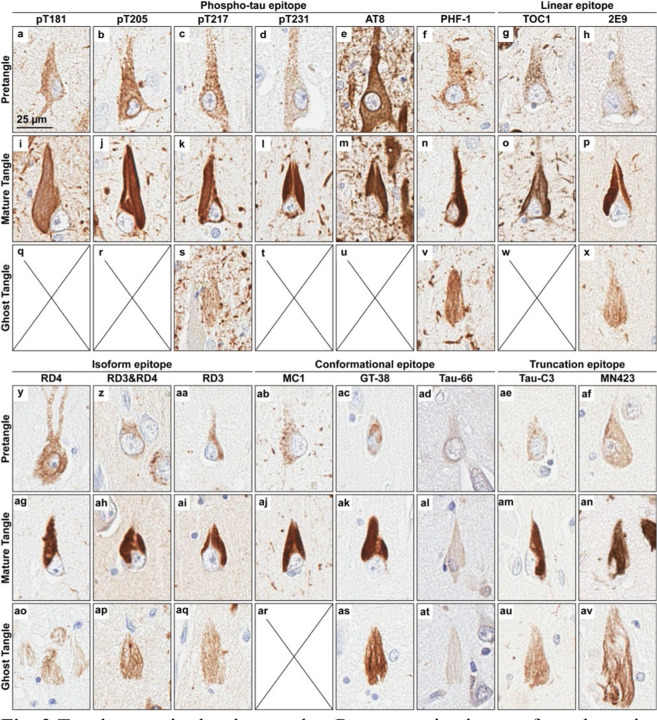
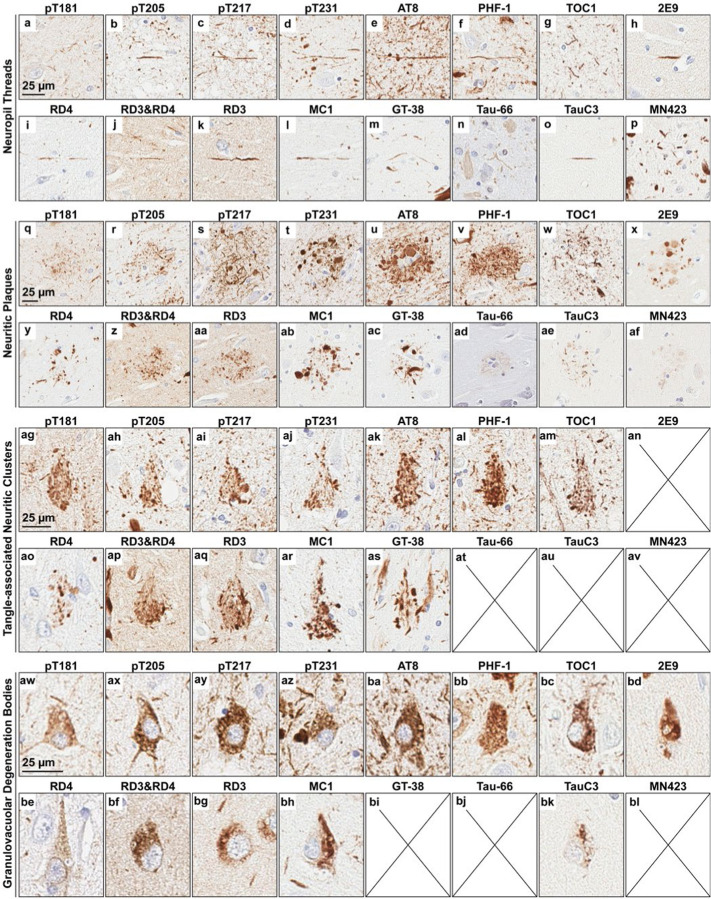
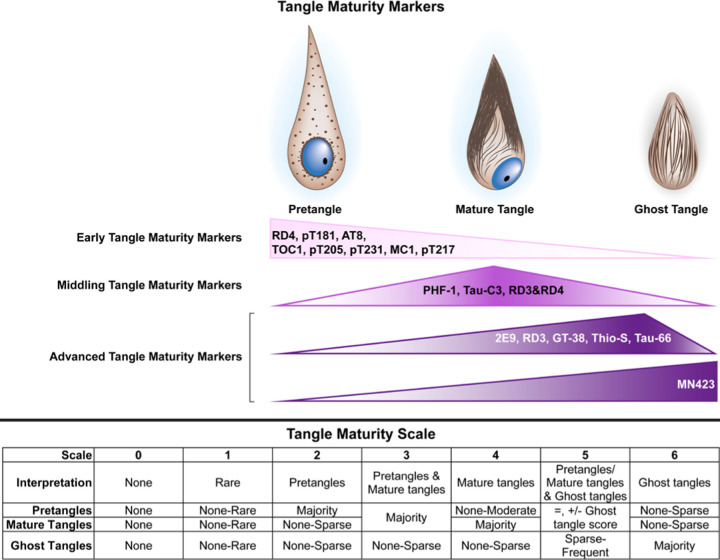
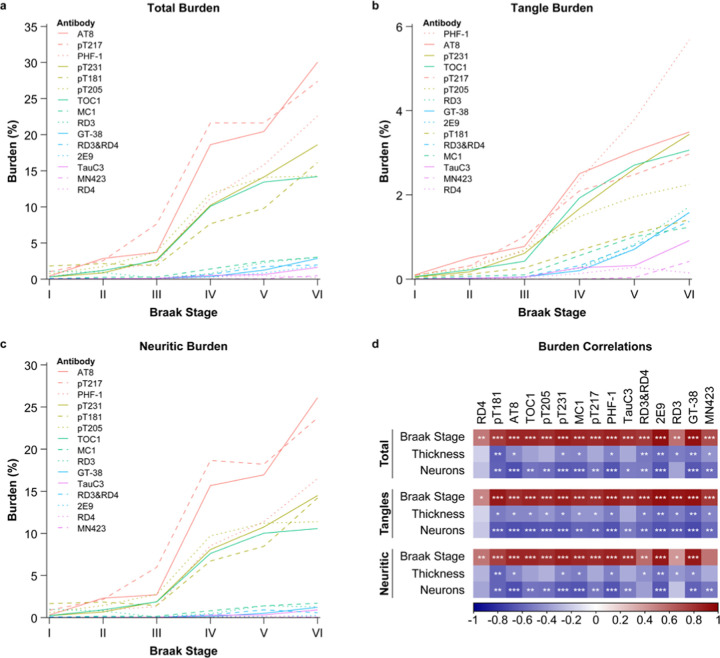
Neurofibrillary tangles are dynamic neuropathologic hallmarks of Alzheimer's disease with a hypothesized lifespan morphologically-defined by three maturity levels: pretangles, mature tangles, and ghost tangles. To better understand the progression of tangle pathophysiology, we characterized tangle maturity level predilection of 15 tau antibodies recognizing a broad range of linear, phosphorylation, conformational, and truncation epitopes in the hippocampus of 24 postmortem brains. We developed the tangle maturity scoring system to semi-quantitatively evaluate each tangle maturity level. Based on proportions of tangle maturity levels, we classified antibodies as "early" (mostly pretangles and mature tangles), "middling" (mature tangles with pretangles and ghost tangles), and "advanced" (mostly ghost tangles and mature tangles) tangle maturity markers. To summarize tangle maturity predilection, we developed the tangle maturity scale to integrate individual tangle maturity scores. Correlations showed stronger relationships between tangle maturity scale and subsector thickness for more advanced tangle maturity markers in CA1 and subiculum, whereas Braak tangle stage remained consistently correlated throughout markers of the tangle lifespan. To aid in scoring hippocampi, we used machine learning to recognize tangle maturity levels, which performed comparably to a domain expert and showed similar relationships by Spearman correlation. Pattern recognition software was used to assess tangle and neuritic tau burden separately, which generally correlated with Braak stage and neuronal counts. However, tangle-derived tau burden more consistently correlated with hippocampal subsector thickness. In conclusion, we developed manual and automated scoring systems to evaluate tangle maturity levels, demonstrating early 4R, phosphorylated, and oligomeric tau accumulation preceding more advanced 3R and truncated tau. Our study provides supportive evidence of disease-relevant ordering of tau posttranslational modifications in the brain, which may have implications for theragnostic development. These findings underscore the promise of computerized quantitative analyses (i.e., pathomics) for high-throughput feature extraction from whole-slide images to enhance our understanding of microscopically observed morphologic changes.

Keywords: Alzheimer’s disease; artificial intelligence; neurofibrillary tangle maturity; tangle maturity scale; tangle maturity score.


Conflict of interest statement

Conflict of interest MHR, SAL, ZP, JFT, ACW, DMR, RD, CL, NMK, and REK report no disclosures. CMM received grant funding from Eli Lilly and Company. NRG-R has taken part in multicenter trials supported by Eli Lilly, Biogen, Eisai and Cognition Therapeutics which is outside the submitted work. He has received publishing royalties from UpToDate, Inc for a chapter on NPH. DWD is an editorial board member of Acta Neuropathologica, Annals of Neurology, Brain, Brain Pathology, and Neuropathology, and he is editor in chief of American Journal of Neurodegenerative Disease. MEM received grant funding from Eli Lilly and Company and receives consulting fees from Biogen.

Figures

Fig. 1
Fig. 1
Antibody epitopes plotted along the linear 2N4R tau 441 amino acid structure with alternatively spliced regions indicated by diagonal lines. Light blue represents the amino-terminal (N-terminal) inserts, yellow the microtubule binding repeat region, pink the linear epitopes, green the phosphorylation epitopes, orange the conformational epitopes, and purple the truncation epitopes. Epitopes are detailed in Table 1. Figure adapted from [51]. Note: TOC1 recognizes a linear epitope upon conformation following N. terminal cleavage event [74]. Abbreviations: N, amino; C, carboxy, PR, proline-rich region; R, repeat domain
Fig. 2
Fig. 2
Pathomics workflow for processing whole slide images using the Tangle-mat AI model. Digitized whole slide images are divided into 600×600 pixel tiles, each tile is analyzed with a fine-tuned RetinaNet model, and predictions are aggregated to generate whole-slide counts. Counts were used by the Tangle-mat AI model to convert to tangle maturity scale, as shown in the table. Acronyms: AI, artificial intelligence
Fig. 3
Fig. 3
Tangle maturity level examples. Representative images from the series of pretangles (a-h, y-af), mature tangles (i-p, ag-an), and ghost tangles (q-x, ao-av) stained with pT181 (a, i, q), pT205 (b, j, r), pT217 (c, k, s), pT231 (d, l, t), AT8 (e, m, u), PHF-1 (f, n, v), TOC1 (g, o, w), 2E9 (h, p, x), RD4 (y, ag, ao), RD3&RD4 combined (z, ah, ap), RD3 (aa, ai, aq), MC1 (ab, aj, ar), GT-38 (ac, ak, as), Tau-66 (ad, ail, at), TauC3 (ae, am, au), and MN423 (af, an, av). Rare tau aggregates of abnormal size were observed with advanced tangle maturity markers as exaggerated ghost tangles, informally referred to as “gigantaurs” (av). Scale bar measures 25 µm and applies to all images.
Fig. 4
Fig. 4
Non-tangle pathology examples. Representative images from the series of neuropil threads (a-p), neuritic plaques (q-af), tangle-associated neuritic clusters (ag-av), and tangles-bearing neurons with granulovacuolar degeneration (aw-bl) stained with pT181 (a, q, ag, aw), pT205 (b, r, ah, ax), pT217 (c, s, ai, ay), pT231 (d, t, aj, az), AT8 (e, u, ak, ba), PHF-1 (f, v, al, bb), TOC1 (g, w, am, bc), 2E9 (h, x, an, bd), RD4 (i, y, ao, be), RD3&RD4 combined (j, z, ap, bf), RD3 (k, aa, ai, bg), MC1 (l, ab, ar, bh), GT-38 (m, ac, as, bi), Tau-66 (n, ad, at, bj), TauC3 (o, ae, au, bk), and MN423 (p, af, ab, bl). Scale bars measures 25 µm and applies to all images within the specified pathology.
Fig. 5
Fig. 5
Tangle maturity quantification and correlations in the CA1. (a) Stacked bar graph of the proportion of pretangles, mature tangles, and ghost tangles for each stain. (b) Correlogram of Spearman correlations between the tangle maturity scale in the CA1 with Braak stage and tissue health (i.e., CA1 thickness, neurons). (c) Correlogram of Spearman correlations using the model derived tangle maturity scale. *, p<0.05; **, p<0.01; ***, p<0.001.
Fig. 6
Fig. 6
Tangle maturity summary. The tangle maturity markers are classified as “early”, “middling”, or “advanced” tangle maturity markers based on the tangle maturity proportions in the CA1 (Fig. 5a). Early tangle maturity markers include RD4, pT181, AT8, TOC1, pT205, pT231, MC1, and pT217. Middling tangle maturity markers include PHF-1. Tau-C3, and RD3&RD4. Advanced tangle maturity markers include 2E9, RD3, GT-38, thioflavin-S, Tau-66, and MN423. The tangle maturity scale is presented from 0–6, with 0 indicating no tangles, 1 indicating rare tangles, 2 indicating a majority of pretangles, 3 indicating a mix of pretangles and mature tangles, 4 indicating a majority of mature tangles, 5 indicating a mix of pretangles and mature tangles with ghost tangles, and 6 indicating a majority of ghost tangles. Figure adapted from [51]. Abbreviations: Thio-S, thioflavin-S
Fig. 7
Fig. 7
Pathomics-based tau burden analyses and quantification in the CA1. Pattern recognition software (i.e., GENIE) was used to subclassify tangle and neuritic burger from total tau immunoreactivity. Total, tangle, and neuritic burden in the CA1. Line graphs of (a) total burden, (b) tangle burden, and (c) neuritic burden in CA1 for each Braak stage. (d) Correlogram of Spearman correlations between total burden, tangle burden, or neuritic burden in the CA1 for each stain with neuronal count, CA1 thickness, and Braak Stage. The line graph key is organized by highest to lowest burden at Braak stage VI. *, p<0.05; **, p<0.01; ***, p<0.001.

References

    1. Alzheimer A (1911) Über eigenartige Krankheitsfälle des späteren Alters. Zeitschrift für die gesamte Neurologie und Psychiatrie 4: 356–385. 10.1007/bf02866241 - DOI
    1. Alzheimer A (1907) Über eine eigenartige Erkankung der Hirnrinde. Allgemeine Zeitschrift fur Psychiatrie und Psychisch-gerichtliche Medizin 18: 177–179.
    1. Alzheimer A, Stelzmann RA, Schnitzlein HN, Murtagh FR (1995) An English translation of Alzheimer’s 1907 paper, “Uber eine eigenartige Erkankung der Hirnrinde”. Clin Anat 8: 429–431. 10.1002/ca.980080612 - DOI - PubMed
    1. Aragao Gomes L, Uytterhoeven V, Lopez-Sanmartin D, Tome SO, Tousseyn T, Vandenberghe R, Vandenbulcke M, von Arnim CAF, Verstreken P, Thal DR (2021) Maturation of neuronal AD-tau pathology involves site-specific phosphorylation of cytoplasmic and synaptic tau preceding conformational change and fibril formation. Acta Neuropathol 141: 173–192. 10.1007/s00401-020-02251-6 - DOI - PubMed
    1. Arezoumandan S, Cousins KAQ, Ohm DT, Lowe M, Chen M, Gee J, Phillips JS, McMillan CT, Luk KC, Deik A et al. (2024) Tau maturation in the clinicopathological spectrum of Lewy body and Alzheimer’s disease. Ann Clin Transl Neurol 11: 673–685. 10.1002/acn3.51988 - DOI - PMC - PubMed

Publication types

LinkOut - more resources