[Preprint]. 2025 May 28:2025.05.27.654663.
doi: 10.1101/2025.05.27.654663.

Double strand breaks drive toxicity in Huntington's disease mice with or without somatic expansion

Affiliations

Double strand breaks drive toxicity in Huntington's disease mice with or without somatic expansion

Aris A Polyzos et al. bioRxiv. .

Abstract

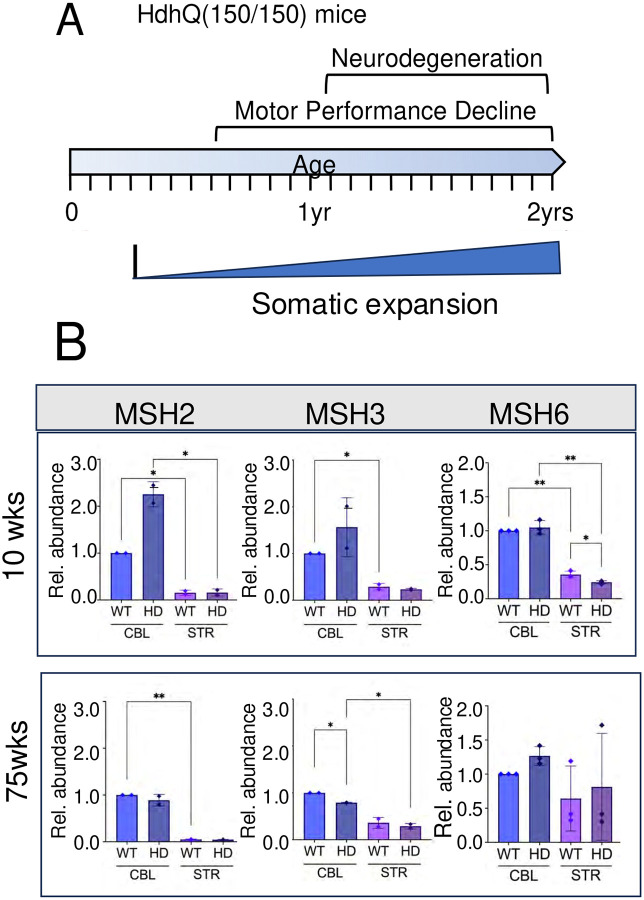
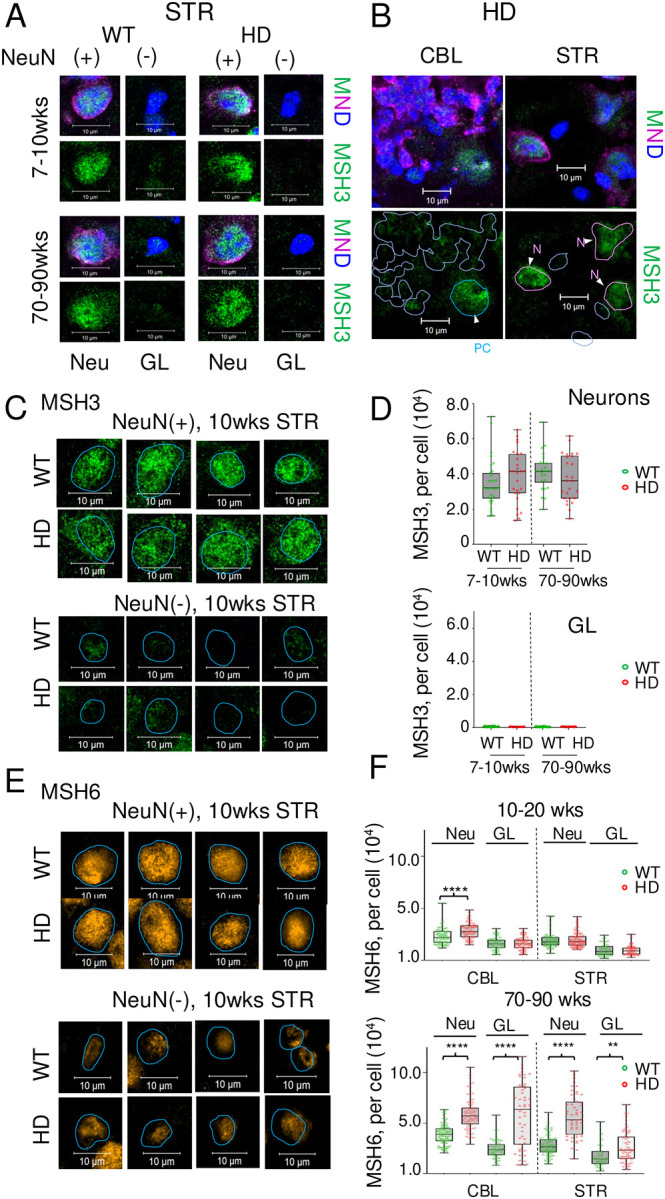
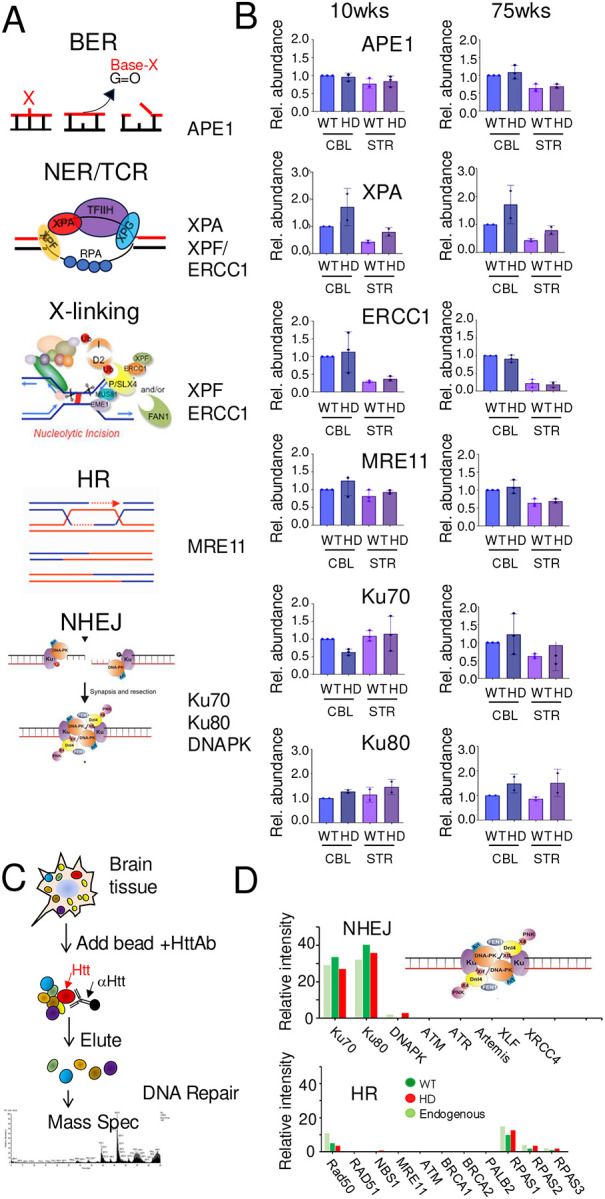
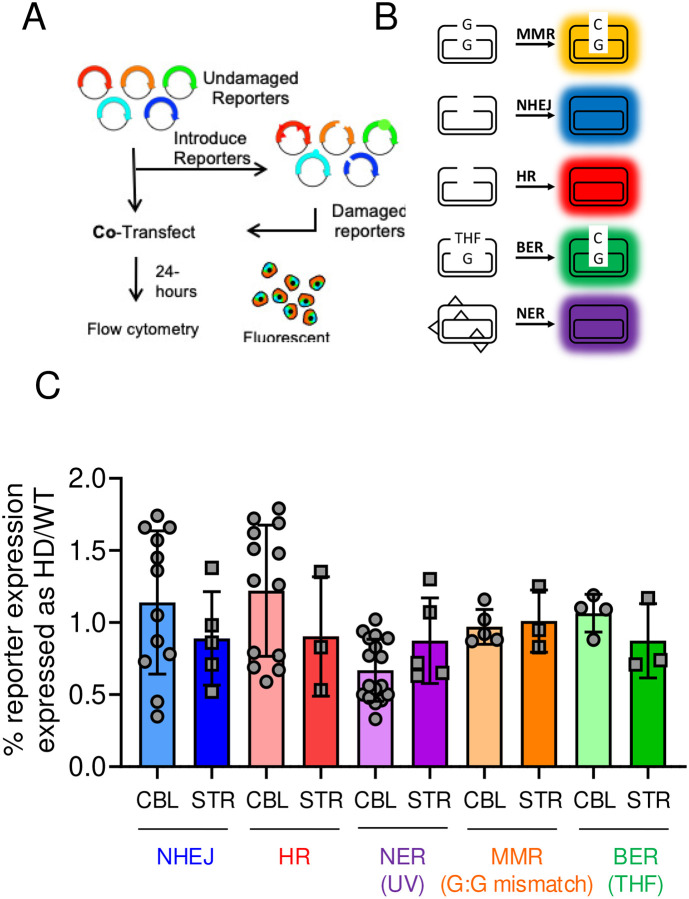
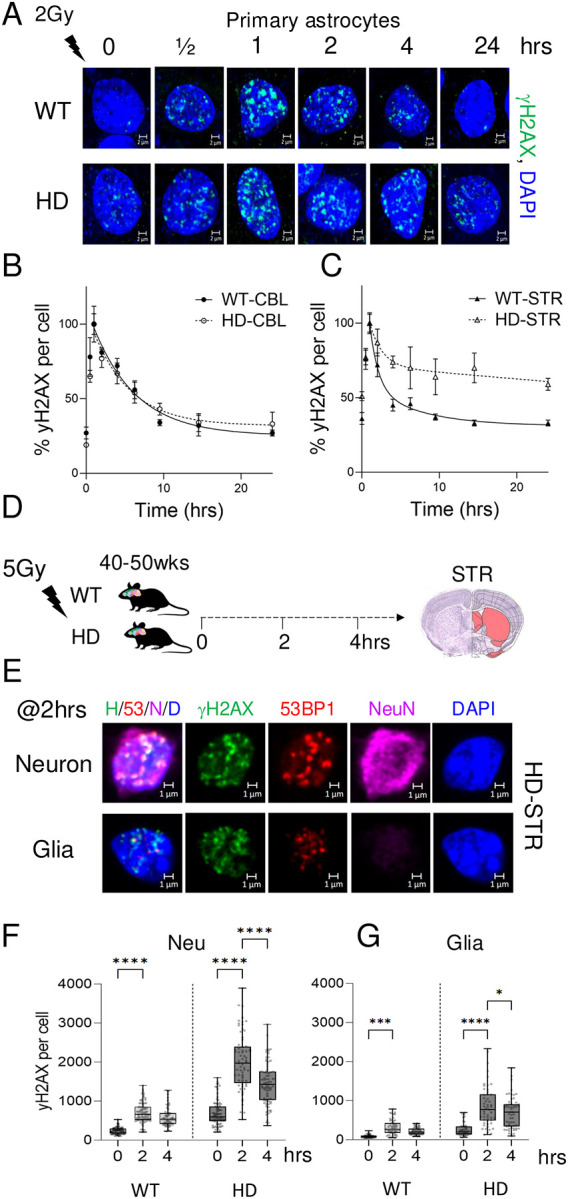
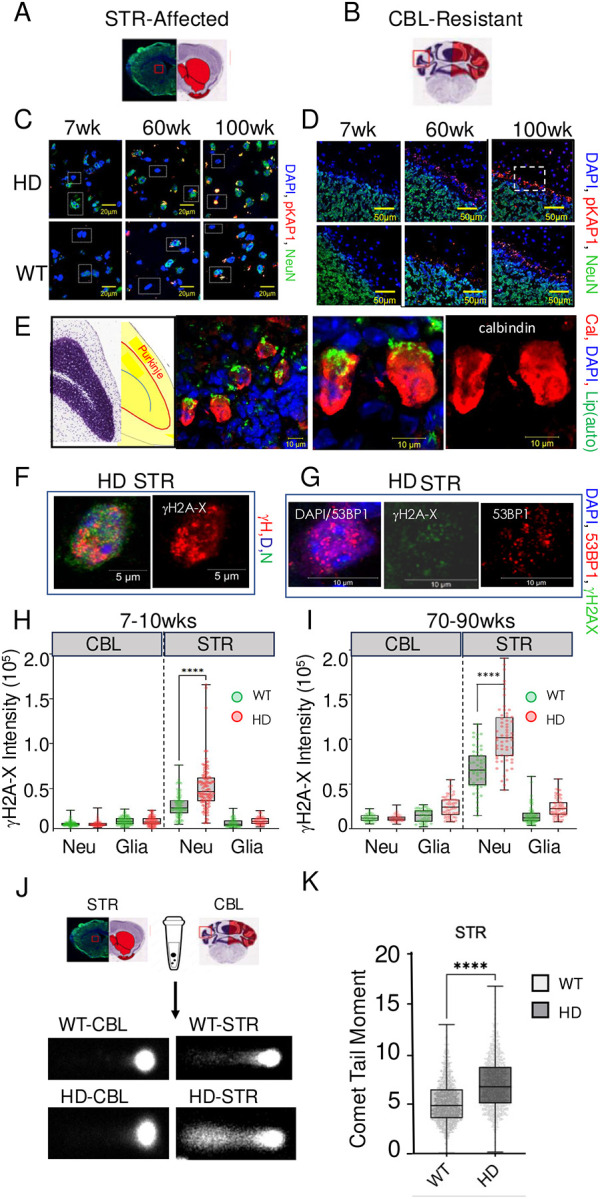
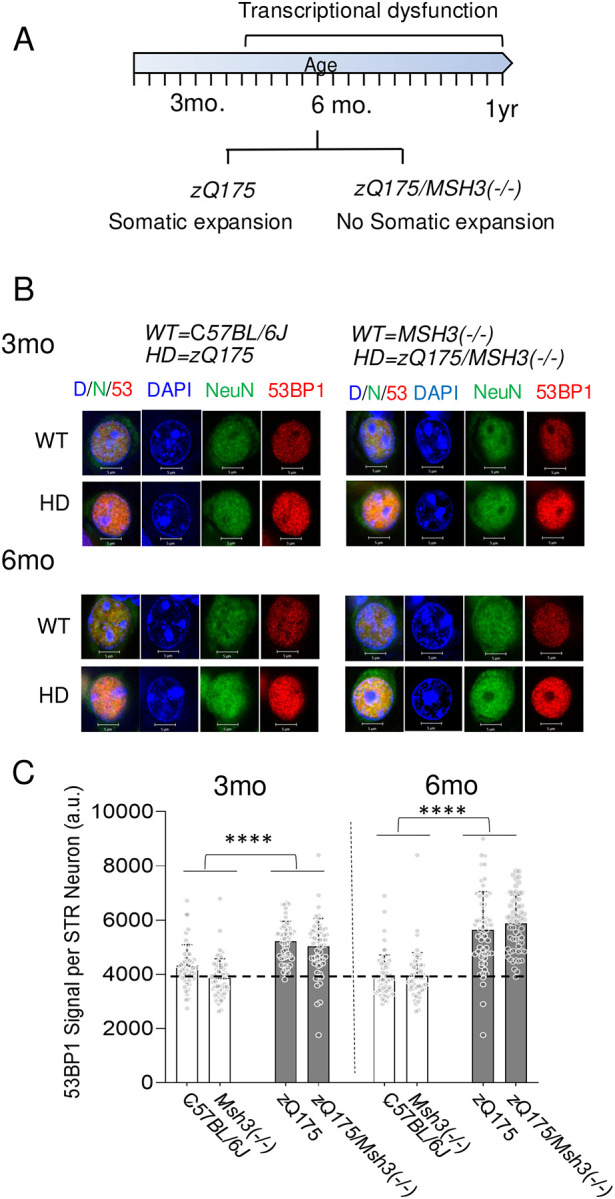
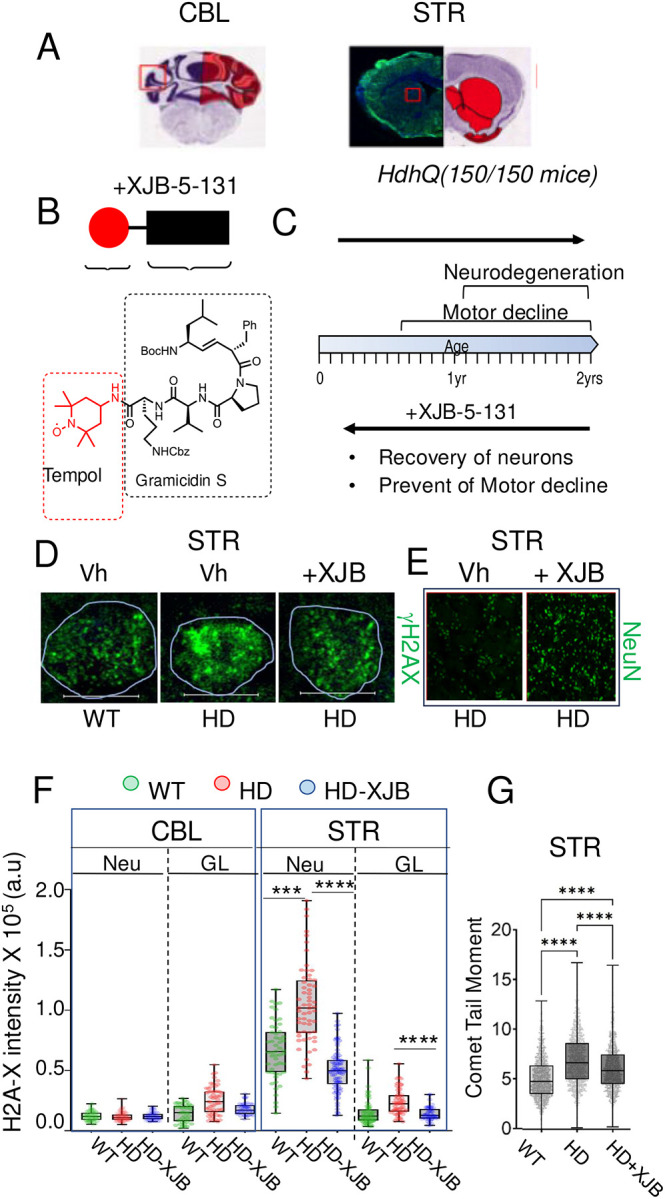
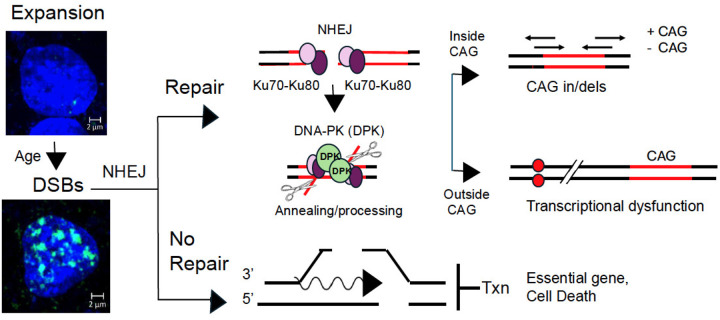
There has been a substantial investment in elucidating the mechanism of expansion in hopes of identifying therapeutic targets for Huntington disease (HD). Although an expanded CAG allele is the causal mutation for HD, there is evidence that somatic expansion may not be the only disease driver. We report here that double strand breaks (DSBs) drive HD toxicity by an independent mechanism from somatic expansion. The mutant HD protein inhibits non-homologous end joining (NHEJ) activity, leading to the accumulation of DSBs. DSBs promote transcriptional pathology in mice that cannot expand their CAG tracts somatically. Conversely, Inhibition of DSBs reverses neuronal toxicity in animals that undergo somatic expansion. Although they coexist in neurons, DSBs and somatic expansion are independent therapeutic targets for HD.


Conflict of interest statement

Competing Interest statement The authors declare no competing interests.

Figures

Fig. 1:
Fig. 1:. Mouse brain expresses the MMR recognition machinery necessary for expansion in WT and HdhQ(150/150) mice.
(A) Schematic diagram of timing and properties of pathophysiology and somatic expansion in HdhQ(150/150) animals over 2 years, summarized from. Representative examples of Genescan for repeat sizing at 30 weeks are provided in Supplemental Fig. 1A. (B) Western analysis of MSH2, MSH3, and MSH6 in the affected STR and the resistant CBL in n=3 animals of 10–11 wks and three n=3 animals between 74–76 wks (referred to as 10 wks and 75wks) from brain extracts of HdhQ(150/150) animals and age and gender matched C57BL/6J controls (referred to as HD and WT, respectively). Two samples were resolved side by side indicated by the number 1 and 2 (Supplemental Fig. 2A) and data for a third animal is presented in the source file data. Six technical replicates of the SDS-PAGE gels are shown of each genotype at 10wks and 75wks. (Supplemental Fig. 2A). Each replicate gel was transferred to membranes and probed with specific antibodies to the indicated protein (P) or to GAPDH (C) with the molecular weight markers (kD) to the side of each gel (Supplemental Fig. 2A) The relative abundance of MSH2, MSH3 and MSH6 expression was normalized relative to the WT CBL. Protein antibodies are listed in Supplementary Table 1. Error bars represent standard deviation with the minimum (lower bar) and maximum (upper bar) values for the samples at each age. Significance was determined by a 1-way ANOVA; P is * 0.01 < p ≤ 0.01, **0.001 < p ≤ 0.01.
Fig. 2:
Fig. 2:. MSH3 and MSH6 expression is prominent in neurons of WT and HdhQ(150/150) mice.
Single cell analysis of the MSH3 in the affected STR and resistant CBL of WT and HD animals. (A) Magnified images of MSH3 immunofluorescence (IF) for antibodies in individual cells within tissue sections from the STR of WT or HD animals of 15–20 wks or 70–90 wks, as labeled; (M, MSH3, green), (N, NeuN, magenta), (D, DAPI, blue). Scale bar is 10μm. The nuclear marker, DAPI (blue), neuronal marker, NeuN (N, purple) and MSH3 (M, green) staining are shown as an overlay (M,N,D) or MSH3 as an individual channel image (MSH3). NeuN(+) cells are neurons and NeuN(−/−) cells are glia. MSH3 co-stained prominently in NeuN(+) cells (purple) independent of genotype. More examples shown for STR of WT and HD animals in Supplemental Fig. 2B,C. (B) Same as (A) but comparing the IF of MSH3 expression in STR and CBL of 7–10 wk HD animals: (Left, CBL) The nuclear contours from the DAPI stain outlined in light blue indicate the position of the nucleus and highlight the poor MHS3 protein (green) staining intensity in most cells of the CBL; (Right, STR) MSH3 is strongly expressed in striatal neurons, which are delineated by the purple outline, and poorly expressed in DAPI(+), NeuN(−) glia. Scale bar is 10μm. (C) Magnified images of neurons (top) and glia (bottom) in the STR of 10wks WT and HD animals detected by IF antibody staining for MSH3. MSH3 expression is highest in neurons. (D) Quantification of MSH3 expression as determined by the average per cell staining intensity of 50 NeuN(+) neurons (top plot) and 50 NeuN(−) glia (bottom plot) in the striatal tissue sections from n=3 in WT(green bars) or HD (red bars) animals at 7–10wks or 70–90 wk. Data are displayed as a box and whisker plot, where the box are 25–75% of the values, the line indicates the median value, and 25% maximum values and 25% minimum values are indicated by whiskers above and below the box, respectively. (E) Same as C for MSH6 (orange), (F) same as E for MSH6. Significance was determined by a 1-way ANOVA; P is **0.001 < p ≤ 0.01 and **** p < 0.00001.
Fig. 3.
Fig. 3.. Htt and mhtt interacts with the DSBR machinery in tissues from WT and HdhQ(150/150) mice.
(A) Schematic diagram of major DNA repair pathways. The representative pathway proteins measured in (B) are indicated to the right of the schematic. (B) Western blot detection is the same as described in Fig. 1C but for Apurinic/apyrimidinic (AP) endonuclease (APE1); Xeroderma Pigmentosum Group A protein (XPA), Xeroderma Pigmentosum Group F protein (XPF), and Excision Repair Cross-complementation group 1 (ERCC1); Meiotic Recombination 11 Homolog 1 (MRE11); X-ray repair cross-complementing 6 (Ku70); X-ray repair cross-complementing 5 (Ku80), at the indicated ages. The proteins extracts were resolved in ten technical replicate SDS-PAGE gels; five gels for proteins measured in 10 wk animals (left) and five for proteins measured in 75 wk animals (right). Each blot was probed with indicated antibodies to a representative pathway protein (P) or GAPDH (C) (Supplemental Fig. 3). The protein expression data are normalized relative to the WT CBL. Error bars represent standard deviation with minimum (lower bar) and maximum (upper bar) values for the clonal samples. Source data and Full uncropped gels are provided in Supplementary Source File. The protein antibodies are listed in Supplementary Table 1. (C,D) Immunoprecipitation/Mass spectrometry (IP-MS) analysis of the interactions of DNA repair proteins with htt or mhtt. (C) Schematic diagram of the IP-MS analyses. (D) The IP-MS spectrometry results for endogenous NIH3T293 cells (light green) or for NIH3T293 cells overexpressing htt (dark green) or mhtt (red). (Top) Only NHEJ components or (bottom) HR components were identified among the pathways. The analogous IP-MS analysis of striatal tissue from WT and HdhQ(150/150) mice is shown in Supplemental Fig. 4.
Fig. 4:
Fig. 4:. Mhtt inhibits the activity of NHEJ pathway of DSBR.
(A) Schematic for the fluorescence multiplex host cell reactivation (FM-HCR) assay of different DNA repair pathways in primary glial cultures from the STR and the CBL of WT and HD animals. (B) Schematic diagram of the color-coded reporter plasmids for the indicated pathways; HR, NHEJ, MMR, NER, BER. Primary glia were seeded and transfected with sufficient efficiency (4–8%) to afford a robust analysis of fluorescence intensity by flow cytometry and DNA repair capacity in the transiently transfected cells, described in text. (C) Activity plotted as % reporter expression of repair pathway in WT (light colors) and HD (darker colors) for each pathway, normalized for WT CBL. Repair activities were measured in plated glial cultures; n = 6 for CBL and n = 5–12 for the STR. Data are displayed as a box and whisker plot, where the box are 25–75% of the values, the line indicates the median value, and 25% maximum values and 25% minimum values are indicated by whiskers above and below the box, respectively.
Fig. 5.
Fig. 5.. Repair of Induced DSBs is inhibited in vitro and in vivo.
(A) The dynamics of γH2AX foci in primary glia cultures from STR in WT (top) or HD (bottom) animals exposed to 2Gy irradiation over 24hrs. The cells were co-stained with γH2AX (green) and DAPI (blue); γH2AX foci are turquoise in the overlay images. Scale bars is 2μm. (B) γH2AX foci signal intensity plotted as a function of time (hrs) and quantified in at least 100 glia cells from the CBL(left) and STR (right) of WT and HD animals in cultures from n=3 dissections. (D) Schematic illustration of DSB induction by radiation damage in the STR of WT and HD animals of 40–50wks. Animals were irradiated with a single 5Gy dose at the beginning of the experiment and the generated DSBs were quantified by γH2AX foci formed up to 4 hours post irradiation. Allen brain Atlas image indicating in red the STR tissue tested. (E) Examples of striatal DSBs 2 hours post-irradiation in magnified images of neurons and glia of WT or HD animals at 70–90wks. Shown is IF intensity from co-staining with γH2AX (green), NeuN (purple), DAPI (blue), or 53BP1 (red), as separate channel images (panels 2–5) or as an overlay of all four stains (H/53/N/D, panel 1) in striatal tissue sections from HD animals. Co-staining of γH2AX and NeuN(+) cells defined DSB localization in neurons, while γH2AX in NeuN(−) cells were taken as DSBs in glia. (F,G) Quantification of DSBs at the single cells level for neurons (F) and glia (G) in whole tissue sections from WT or HD animals up to 4 hours post-irradiation, as judged by the staining intensity of γH2AX. Points shown are individual scored γH2AX signals from at least n=50 cells per tissue section (n=3 animals). Data are displayed as a box and whisker plot, where the line indicates the median value, the box are 25–75% of the values, and 25% maximum values and 25% minimum values are indicated by whiskers above and below the box, respectively. The probability statistics for all comparisons was determined from a 1-way ANOVA. P is * 0.01 < p ≤ 0.01, **** p < 0.00001.
Fig. 6:
Fig. 6:. DSBs accumulate in neurons of HD mice.
(A,B) Allen brain Atlas image for STR(A) and CBL(B) in H&E-stained experimental tissue sections. NeuN staining of the section is shown to the left in the ST. The segments used for imaging are indicated in red. (C) Representative IF images of striatal tissue sections for HD (top) compared to WT (bottom) mice, stained with antibody to pKAP (red), nuclear DAPI (blue), and NeuN (green) of male mice at 7, 60, and 100wks. Scale bar is 20μm. (D) Same as (C) for CBL. Little pKAP staining is observed in cerebellum except for a single Purkinje cell (PC) cell layer adjacent to dense granular neurons. Scale bar is 50μm. (E) Diagram of PC layer in the mouse CBL (panel 1). (Panel 2) A 5-fold magnified image of the PC layer in the white hatched box in D (100wk) stained with DAPI (blue) and calbindin (red), a marker for PC cells. Scaler bar is 10μm. Green emission is generated from the lipid autofluorescence (panel 3,4). A two-fold magnification of PC in panel 2, with (panel 3) or without (panel 4) the lipofuscin autofluorescence signal. (F) (left) Overlay image of co-staining with DAPI (blue), NeuN (green) and γH2AX (red) in a magnified image of a striatal tissue section from an HD mouse of 70–90 wks; (right) γH2AX (red) alone. Scale bar is 5μm. (G) Same as (F) co-stained with two DSB markers in the same cell: (left) overlay image of DAPI (blue) and 53BP1 (red); (middle) γH2AX (green) alone; (right) 53BP1 (red) alone in a separate channel image. Scale bar is 10μm. (H,I) Single cell quantification of DSBs in neurons and glia from the IF intensity in tissue section from WT and HD mice at 7,8 wks (H) and 70–90wks. (I). Neurons were identified as NeuN(+) cells in the tissue section (see F). WT is green, HD is red. γH2AX staining was quantified from n=50 randomly selected cells of each type in n=3 tissue sections of 7,8wk (left) or 70–90wk (right) animals, respectively. Data are displayed as a box and whisker plot, where the box are 25–75% of the values, the line indicates the median value, and 25% maximum values and 25% minimum values are indicated by whiskers above and below the box, respectively. The probability statistics for comparing significance among regions were determined from a 1-way ANOVA are **** P < 0.0001 for the neurons. (J) Examples of comet tails from dispersed cells collected from the STR (top, left) and CBL (top right) of WT and HdhQ(150/150) tissue sections, as indicated. The imaging software delineates the comet head and the tail portion, which is visible for the STR. (K) Quantification of comet tail moments for the STR of WT (light gray) or HD (dark gray) mice at 70–90 wks. Points shown are individual scored comets from at least n=550–890 cells per tissue section (n=3 animals). Data are displayed as a box and whisker plot, where the box is 50% of the values, the line is the median value, and 25% maximum and 25% minimum values are indicated by whiskers above and below the box, respectively. Regional comparions were determined for signifiance using a 1-way ANOVA. ****, P < 0.00001 for the comparison.
Fig. 7:
Fig. 7:. DSBs increase together with progressive transcriptional dysfunction in zQ175/MSH3(−/−) animals that cannot expand their CAG tract.
(A) Summary of measured pathology and somatic expansion quantified in zQ175 and in zQ175/MSH3(−/−) animals as published previously. Somatic expansion is attenuated in zQ175/MSH3(−/−) animals. (B) The DSBs compared among tissue sections from WT, zQ175/MSH(+/+), MSH3(−/−) and zQ175/MSH3(−/−) at 3 and 6 months. Example of magnified neurons at 3mo (top) and 6mo (bottom) from brain tissue sections of (left) WT and zQ175 mice and (right) MSH3(−/−) and zQ175/MSH3(−/−) mice stained with nuclear DAPI (blue)(panel 2), NeuN neuronal marker (panel 3, green), the 53BP1 DSB marker (panel 4, red) or an overlay of all three (D/N/53, panel 1). The genotypes designated as WT and HD are indicated at top. (C) Plot of DSBs as measured by 53BP1 staining intensity in neurons per indicated genotype at 3 or 6 months. At least n=50 cells per region were scored for DSBs in minimally three sections (n = 3). DSBs are elevated in zQ175 and zQ175/MSH3(−/−) animals at 3 and 6 months (gray bars), compared to the brains of WT or MSH3(−/−) control strains (white bars), respectively. Data are displayed as a standard deviation. Genotype comparions were determined for signifiance using a 1-way ANOVA. ****, P < 0.00001 for all comparisons.
Fig. 8:
Fig. 8:. XJB-5-131 treatment of HdhQ(150/150) mice attenuates DSBs and prevents neuronal death.
(A) Allen Brain Atlas map of affected STR and the resistant CBL for reference. (B) Diagram of functional residues of the XJB-5-31 ROS inhibitor and its chemical structure. The red ball represents the tempol antioxidant (red) (red hatched box), which is fused to a mitochondria-targeted carrier peptide (black) (black hatched box). The target carrier peptide is based on the Gramicidin S, an antibiotic that targets the mitochondrial membrane directly. XJB-5-131 prevents base oxidation and SSB to DSB conversion. (C) WT or HD animals were aged to 60wks to allow accumulation of DSBs, before starting treated with saline vehicle (Vh) or XJB-5-131 for 30 wks. Brain sections from 90wks animals were harvested and the sections were evaluated for DSBs, neuronal loss in tissue sections, and somatic expansion in dissected tissue from a contiguous section. Summary of reversible pathology quantified in HdhQ(150/150) mice before and after XJB-5-131 treatment. (D) DSBs detected in brain sections by the IF signal intensity of the γH2AX DSB antibody marker (green) in WT or HdhQ(150/150) mice. Vehicle (Vh) was saline. Shown are magnified striatal neurons from Vh-treated WT (WT, panel 1), Vh-treated HdhQ(150/150) mice (HD, panel 2), and XJB-5-131 treated HdhQ(150/150) mouse (HD +XJB, panel 3). Scale bar is 10μm. (E) Corresponding NeuN antibody staining for (D) in tissue fields for Vh (left) or XJB-5-131-treated (right) HdhQ(150/150)(HD) mice. (F) Single cell analysis of derived from γH2AX IF signal intensity of WT (C57BL/6J) mice treated with Vh (green); HdhQ(150/150)(HD) mice treated with Vh (red) or XJB-5-131 (blue). The quantification is the average of 50 randomly selected NeuN positive neurons (Neu) and 50 randomly selected NeuN(−) glia (GL) from CBL and STR of (n=6) mice of each treatment group. Data are displayed as a box and whisker plot, where the box is 50% of the values, the line is the median value with 25% maximum and 25% minimum values indicated by whiskers above and below the box, respectively. The significance of the DSB marker intensity between treatment groups were evaluated using a 1-way ANOVA, **** P < 0.00001. G. Neutral comet for DSBs. n=1300–1600 comet tails per sample. Dispersed brain cells from each sample were collected at 70wks for neutral Comet Assay for WT(Vh), (HD) (Vh) or HD(XJB-5-131) (dark gray), as indicated. Data are displayed as a box and whisker plot as described for F; the significance of the treatment specific comparisons of DSB marker level were evaluated using a 1-way ANOVA, **** P < 0.00001.
Fig. 9:
Fig. 9:. Model for the impact of DSBs in promoting HD toxicity.
(Left) Cells with an expanded CAG tract (upper) develop DSBs with age (lower) as an indicated by accumulation of gH2AX foci staining. Scale bar is 2μm. (Right) Model for the role of DSBs in promoting HD toxicity. (Repair, NHEJ). NHEJ uses Ku70/Ku80 dimer to recruit DNAPK and the nuclease Artemis (scissors) to prepare two broken DNA ends for ligation. Extensive DNA end resection is prevented by Ku binding and artemis typically removes short regions of DNA to expose patches of microhomology. (Inside CAG tract) if the DSBs occur within a CAG repeat tract (red), microhomology is high and nuclease processing results in no change, or small insertions/deletions of CAG repeats. (Outside CAG tract). DSBs occur preferentially outside the CAG tract in HD animals. Annealing is imperfect at random genomic sequences. Artemis typically removes short regions of DNA to expose patches of microhomology and removes compatible bases to improve homology., often resulting in somatic mutations in the genome (red balls). The resulting somatic mutation occur most frequently in gene enhancers. influencing transcriptional regulation. (No repair) Unrepaired DSBs within a gene will terminate transcription, and if the DSB occurs in an essential gene, will cause death.

Similar articles

References

    1. Gusella J.F. et al. Huntington’s disease: nearly four decades of human molecular genetics. Hum Mol Genet. 30(R2):R254–R263 (2021). - PMC - PubMed
    1. Jiang A. et al. From Pathogenesis to Therapeutics: A Review of 150 Years of Huntington’s Disease Research. Int J Mol Sci. 24, 13021 (2023). - PMC - PubMed
    1. Pengo M. & Squitieri F. Beyond CAG Repeats: The Multifaceted Role of Genetics in Huntington Disease. Genes (Basel) 15, 807 (2024). - PMC - PubMed
    1. Jurcau A. Molecular Pathophysiological Mechanisms in Huntington’s Disease. Biomedicines 10, 1432 (2022). - PMC - PubMed
    1. Khan S. et al. The Huntington’s disease drug pipeline: a review of small molecules and their therapeutic targets. Prog Mol Biol Transl Sci. 211,169–207 (2025). - PubMed

Publication types

LinkOut - more resources