

This is a preprint.
Chromosome-length genome assembly of Uta stansburiana and gene expression data reveal fast pace-of-life comes with environmental stability
- PMID: 40501859
- PMCID: PMC12154890
- DOI: 10.1101/2025.05.28.656178
Chromosome-length genome assembly of Uta stansburiana and gene expression data reveal fast pace-of-life comes with environmental stability
Abstract
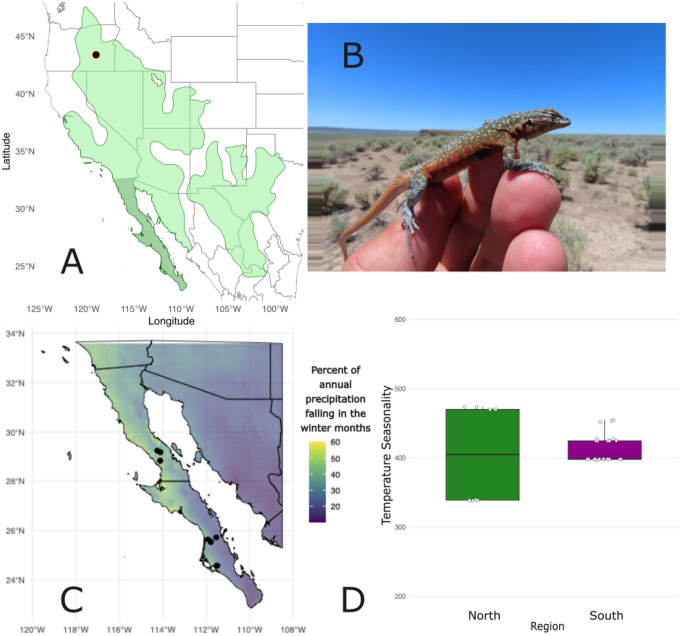
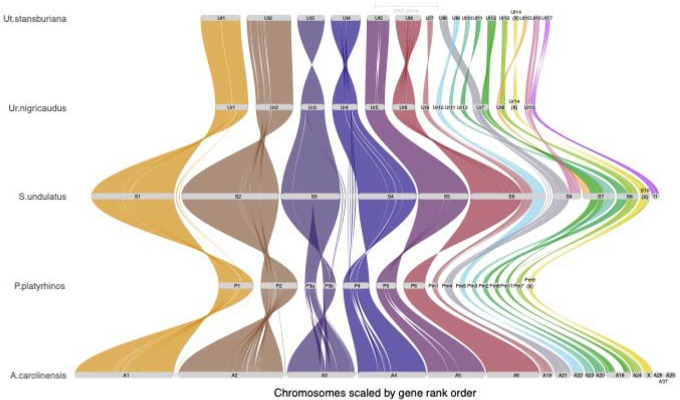
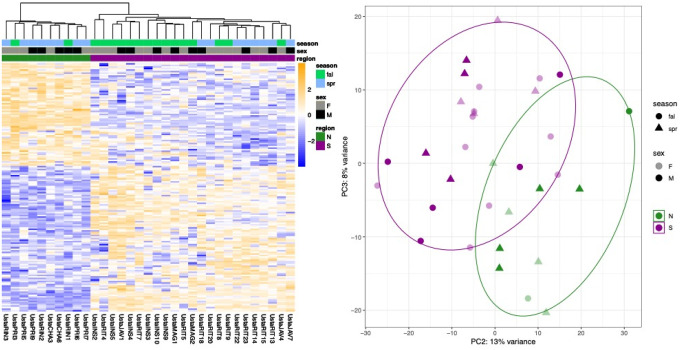
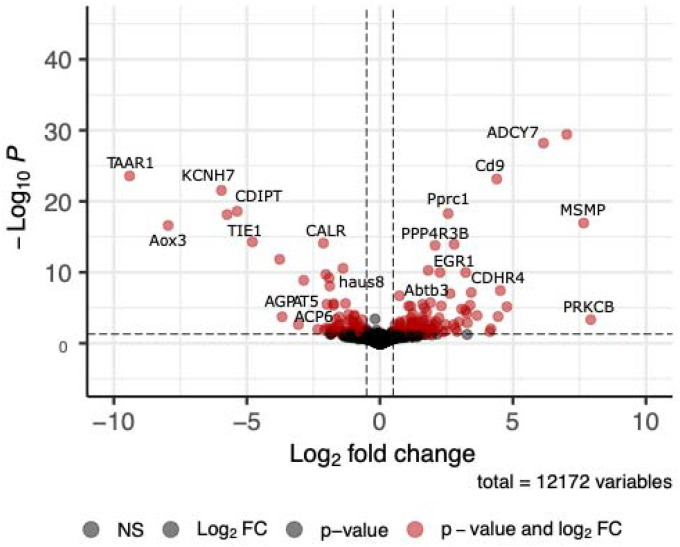
Uta stansburiana are an emerging model system for studying sexual selection, polymorphism, and the evolution of pace-of-life syndromes (POLS) whose distribution covers variable environments and a wide latitudinal gradient. POLS are suites of traits causing variation of life history along a slow maturing-fast maturing continuum. We present a high-quality chromosome-level reference genome for U. stansburiana and pair it with RNA-seq gene expression data to demonstrate, for the first time, the molecular basis for pace-of-life differences between locations with higher and lower climate seasonality and sexual size dimorphism (SSD). Our assembly is 2.1 Gbp, has scaffold N50 of 320 Mbp, includes 104 scaffolds, and has an L50 of 3. The assembly comprises six macrochromosomes and 11 microchromosomes. We annotated 20,350 genes for the assembly and found a repeat element composition of 49.23%, similar to work in other phrynosomatid lizards. RNA-seq data demonstrate differential expression in genes associated with pace-of-life divergence including those related to stress, sexual reproduction, and cell proliferation/carcinogenesis between distinctive environments. Our results provide the first differential gene expression evidence of environmentally mediated pace-of-life processes related to different degrees of SSD in U. stansburiana and demonstrate the utility of RNA-seq gene expression data in detecting POLS.
Keywords: Baja California; RNA-seq; Uta stansburiana; chromosome-level genome assembly; pace-of-life syndrome; seasonality.
Figures
Similar articles
-
Omega-3 fatty acids for depression in adults.Cochrane Database Syst Rev. 2021 Nov 24;11(11):CD004692. doi: 10.1002/14651858.CD004692.pub5. Cochrane Database Syst Rev. 2021. PMID: 34817851 Free PMC article.
-
Diagnostic test accuracy and cost-effectiveness of tests for codeletion of chromosomal arms 1p and 19q in people with glioma.Cochrane Database Syst Rev. 2022 Mar 2;3(3):CD013387. doi: 10.1002/14651858.CD013387.pub2. Cochrane Database Syst Rev. 2022. PMID: 35233774 Free PMC article.
-
Systemic pharmacological treatments for chronic plaque psoriasis: a network meta-analysis.Cochrane Database Syst Rev. 2021 Apr 19;4(4):CD011535. doi: 10.1002/14651858.CD011535.pub4. Cochrane Database Syst Rev. 2021. Update in: Cochrane Database Syst Rev. 2022 May 23;5:CD011535. doi: 10.1002/14651858.CD011535.pub5. PMID: 33871055 Free PMC article. Updated.
-
Sertindole for schizophrenia.Cochrane Database Syst Rev. 2005 Jul 20;2005(3):CD001715. doi: 10.1002/14651858.CD001715.pub2. Cochrane Database Syst Rev. 2005. PMID: 16034864 Free PMC article.
-
Carbamazepine versus phenytoin monotherapy for epilepsy: an individual participant data review.Cochrane Database Syst Rev. 2017 Feb 27;2(2):CD001911. doi: 10.1002/14651858.CD001911.pub3. Cochrane Database Syst Rev. 2017. Update in: Cochrane Database Syst Rev. 2019 Jul 18;7:CD001911. doi: 10.1002/14651858.CD001911.pub4. PMID: 28240353 Free PMC article. Updated.
References
-
- Alonzo S.H., Sinervo B. 2001. Mate choice games, context-dependent good genes, and genetic cycles in the side-blotched lizard, Uta stansburiana. Behavioral Ecology and Sociobiology. 49:176–186.
-
- Araya-Donoso R., Biddy A., Munguía-Vega A., Lira-Noriega A., Dolby G.A. 2024. Habitat quality or quantity? Niche marginality across 21 plants and animals suggests differential responses between highland and lowland species to past climatic changes. Ecography. 2024:e07391.
-
- Arnqvist G., Rowe L. 2023. Ecology, the pace-of-life, epistatic selection and the maintenance of genetic variation in life history genes. Molecular Ecology. 32:4713–4724. - PubMed
-
- Baird S.F., Girard C. 1852. Characteristics of some new reptiles in the Museum of the Smithsonian Institution. Proc. Acad. Nat. Sci. Philadelphia. 6:68–70.
-
- Butlin R.K., Smadja C.M. 2018. Coupling, Reinforcement, and Speciation. The American Naturalist. 191:155–172. - PubMed
Publication types
Grants and funding
LinkOut - more resources
Full Text Sources
Research Materials
Miscellaneous