[Preprint]. 2025 Jun 6:2025.06.06.657162.
doi: 10.1101/2025.06.06.657162.

Spatially organized inflammatory myeloid-CD8+ T cell aggregates linked to Merkel-cell Polyomavirus driven Reorganization of the Tumor Microenvironment

Affiliations

Spatially organized inflammatory myeloid-CD8+ T cell aggregates linked to Merkel-cell Polyomavirus driven Reorganization of the Tumor Microenvironment

Maximilian Haist et al. bioRxiv. .

Abstract

Merkel cell carcinoma (MCC) is an aggressive skin cancer with high propensity for metastasis, caused by Merkel-cell-polyomavirus (MCPyV), or chronic UV-light-exposure. How MCPyV spatially modulates immune responses within the tumor microenvironment and how such are linked to patient outcomes remains unknown. We interrogated the cellular and transcriptional landscapes of 60 MCC-patients using a combination of multiplex proteomics, in-situ RNA-hybridization, and spatially oriented transcriptomics. We identified a spatial co-enrichment of activated CD8+ T-cells and CXCL9+PD-L1+ macrophages at the invasive front of virus-positive MCC. This spatial immune response pattern was conserved in another virus-positive tumor, HPV+ head-and-neck cancer. Importantly, we show that virus-negativity correlated with high risk of metastasis through low CD8+ T-cell infiltration and the enrichment of cancer-associated-fibroblasts at the tumor boundary. By contrast, responses to immune-checkpoint blockade (ICB) were independent of viral-status but correlated with the presence of a B-cell-enriched spatial contexts. Our work is the first to reveal distinct immune-response patterns between virus-positive and virus-negative MCC and their impact on metastasis and ICB-response.

Keywords: Immune-checkpoint blockade; Merkel cell carcinoma; Metastasis; Multiplexed imaging; Systems Immunology; Tumor microenvironment; Tumor virus; head and neck carcinoma; spatial biology; spatial context.


Conflict of interest statement

Competing interests G.P.N., and Y.G., have equity in and are scientific advisory board members of Akoya Biosciences. Akoya Biosciences makes reagents and instruments that are dependent on licenses from Stanford University. Stanford University has been granted US patent 9909167, which covers some aspects of the technology described in this paper. Y.G. and M.H. are scientific advisory board members of CellFormatica Inc, outside of the submitted work.

Figures

Fig.1:
Fig.1:. Study design, workflow and profiling of the MCC-TME.
(A) Conceptual framework and experimental setup. (B) Analytical setup. (C) Left: Illustration of key characteristics of the VP MCC-TME. Right: Cartoon depicting the proposed link between viral infection, immunomodulation within the TME and patient outcomes. (D) Summary of patient and sample characteristics within the investigated patient cohort stratified by viral status. (E) Kaplan Meier plot depicting prolonged overall survival for patients with MCPyV-positive MCC as compared to virus-negative disease (p-value determined by log-rank test). (F) Major cell types identified within the CODEX data set represented as UMAP projection. (G) Proportions of major cell types in the overall data set. Color-code from Fig.1F applies. (H) Mean proportions of major cell types per investigated tumor sample with corresponding clinical annotations for location of tissue biopsies, viral status, immunotherapy response, tumor stage at diagnosis and the event of distant metastasis. Each column depicts a single MCC tumor sample. Samples are ordered by Euclidian clustering. Color-codes for major cell types shown in Fig.1F.
Fig.2:
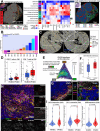
Fig.2:. Distinct cellular composition and T-cell phenotypes define the tumor microenvironment of MCPyV-positive and MCPyV-negative MCC.
(A) Heatmap illustrating log-normalized mean expression of phenotypic (left) and functional markers across the identified cell types of CODEX multiplex imaging with corresponding cell counts. (B) Representative images of the VP-MCC and VN-MCC TME (top) with corresponding cell type maps (bottom). Scale bars, 200 μm and 50μm. Black arrows highlight cell types specifically enriched in VP vs VN-MCC. (C) Cell type frequencies of the major cell compartments in VP-MCC and VN-MCC normalized to the total cell counts, brackets indicate cell types within immune/stroma compartments. (D) Log2-fold enrichment of immune and stroma cell types between VP-MCC and VN-MCC. Tests were adjusted for multiple comparisons using the Bonferroni method with a targeted false discovery rate (FDR) at 0.05 (* p ≤ 0.05, ** p ≤ 0.01). (E) T cell subtype abundances normalized by the total number of T cells and grouped by viral status. Each point represents the mean cell frequency per MCC-sample (n=117). Statistical significance was determined using t-tests adjusted for multiple comparisons using the Bonferroni method with a targeted FDR at 0.05; * p ≤ 0.05, ** p ≤ 0.01, **** p ≤ 0.0001. (F) Representative images of T-cell phenotypes found within VP (top) and VN-MCC with corresponding greyscale images of selected functional markers. Scale bar of 50μm applies to all panels. (G) Heatmaps depicting mean z-normalized expression of functional markers across T-cell subtypes between VP and VN-MCC samples. Mean expression values of each marker in a given cell-type was compared between VP and VN-MCC samples using Wilcoxon-rank sum test adjusted for multiple-hypothesis testing (BH). Non-significant interactions are indicated by dotted lines. (H) Relative abundance of checkpoint-protein positive and negative CD8+ T cell states normalized to the total number of T cells in VP-MCC vs VN-MCC. Each point represents the mean cell frequency per MCC-sample. Significance was determined using Bonferroni-adjusted t-test with FDR <0.05. * p ≤ 0.05, ** p ≤ 0.01, **** p ≤ 0.0001. (I) Relative abundance of checkpoint-protein positive and negative CD8+ T cell states normalized to the total number of T cells in VP-MCC vs VN-MCC. Each point represents the mean cell frequency per MCC-sample. Significance was determined using Bonferroni-adjusted t-test with FDR <0.05.
Fig.3:
Fig.3:. Spatially-restricted expression of immunoregulatory molecules associates with enhanced CD8+ T cell infiltration at the tumor invasive front of VP-MCC.
(A) Left: Cell-type geography map. Center: Identification of 11 distinct CNs based on the 18 granular cell types and their enrichment within each CN (aggregated data from both VN and VP-MCC). Right: CN geography map. (B) Mean Log2-fold enrichment of CNs between VP-MCC and VN-MCC tumor samples (n=117). Statistical significance was determined using t-tests adjusted for multiple comparisons using the Bonferroni method with a targeted FDR at 0.05; * p ≤ 0.05, ** p ≤ 0.01. (C) Representative examples for the spatial distribution of CD8+ T cells within the MCC-TME in VP and VN-MCC. Scale bar of 200μm applies to both panels. (D) Relative enrichment of CD8+ T cells within CNs at the tumor boundary (CN1, left) and the myeloid cell enriched CN2 (right). Statistical significance was determined using Wilcoxon-rank sum test corrected for multiple-hypothesis testing (BH). ** p ≤ 0.01. (E) Left: Schematic of steps used to generate barycentric plots. Right: Barycentric coordinate projection of the interaction of the invasive tumor CNs CN1, CN2, and CN3 across all tumor samples depicted as density plot. (F) Degrees of intermixing amongst CN1, CN2, ad CN3 in VP-MCC vs VN-MCC samples. Each point represents the mean degree of intermixing per MCC tumor sample (n=117). Statistical significance was determined by t-test was adjusted for multiple comparisons using the Bonferroni method with a targeted FDR at 0.05; ** p ≤ 0.01. (G) Representative examples of intersection of CN1-CN2 and CN-3 at the tumor invasive front in VP-MCC and VN-MCC. Scale bars, 200 μm. (H) Representative example of CXCL9+ / CXCL10+ DC-T cell aggregates at the tumor border as shown through combined CODEX and multiplex RNAscope imaging within a VP-MCC tumor core. Scale bar of 100μm applies to all panels. (I) Violinplots depicting the mean expression of immunomodulatory molecules within the myeloid-cell enriched CN2 across VN and VP-MCC samples. Wilcoxon-rank sum test corrected for multiple hypothesis testing (BH) was used to determine statistical significance. Abbreviations: CN, cellular neighborhood.
Fig.4:
Fig.4:. Spatial organization of CXCL9+ PD-L1+ macrophage and DC aggregates with CD8+ T cells at the tumor invasive front.
(A) UMAP projection of myeloid cell subtypes with relative frequency of Ki67+ myeloid cell subtypes (bottom right). (B) Comparison of the myeloid cell type frequencies normalized to the overall myeloid cell counts stratified by MCPyV-status. Each point represents the mean cell frequency per MCC tumor sample (n=117). Significance was determined by Bonferroni-corrected t-test comparisons with FDR < 0.05. *p < 0.05, **p < 0.01. (C) Heatmaps depicting mean z-normalized expression of functional markers across myeloid cell subtypes between VP and VN-MCC samples. Mean expression values of each marker in a given cell-type were compared between VP and VN-MCC samples using Wilcoxon-rank sum test adjusted for multiple-hypothesis testing (BH). Non-significant interactions are indicated by dotted lines. (D) Boxplots depicting relative abundance of inflammatory myeloid cell subtypes in VP-MCC vs VN-MCC. Each point represents the mean cell frequency from all investigated MCC-samples (n=117). Significance was determined by Bonferroni-corrected t-test with FDR < 0.05. * p ≤ 0.05, ** p ≤ 0.01. (E) Representative examples from combined CODEX and RNAscope imaging for the CXCL9+ myeloid cells (green) located at the invasive tumor front that colocalize with PD-L1+ myeloid cells (red) and are in proximity to T cells (black). Scale bars, 200 μm. (F) Boxplots depicting relative abundance of CXCL9+ / PD-L1+ DCs within CNs at the tumor boundary (CN1, CN2) in VP-MCC vs VN-MCC. Each point represents the mean cell frequency from all investigated MCC-samples (n=117). Significance was determined by Bonferroni-corrected t-test with FDR < 0.05. * p ≤ 0.05. (G) Relative enrichment of marker-positive myeloid cell subtypes across CNs. Asterisks indicate CNs and cell types with a regression p-value < 0.05 (not adjusted for multiple testing). Red boxes highlight the enrichment of inflammatory CXCL9+, HLA-DR+, PD-L1+ macrophages and DC within CNs of the invasive tumor front (CN1–3). (H-L) Schematic step-by-step approach used to quantify receptor-ligand interactions within the TME. This includes the identification of PD1+ cells within 20μm of the kNN=10 of a given PD-L1+ anchor cell (I), the quantification and visual confirmation of PD1+ cells in proximity to PD-L1+ anchor cell (J), the quantification of ligand-receptor pairs across all anchors within a region and aggregation over all investigated regions (K). This metric was used to stratify all MCC samples (n=117) by the number of PDL1/PD1 pairs per tumor core based on viral status. Boxplots comparing the number of PDL1/PD1 and CXCL9/CXCR3 ligand-receptor pairs are shown in L including results of BH-adjusted Wilcoxon rank sum test (L). *p < 0.05, **p < 0.01.
Fig.5:
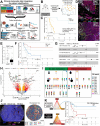
Fig.5:. MCPyV-positivity is linked to prolonged distant-metastasis-free survival in local stage MCC through enhanced CD8+ T cell infiltration.
(A) Analytical framework for the identification of biomarkers associated with distant metastasis. (B) UMAP representation of identified patient clusters separating patients with local stage I/II MCC into high- and low-risk (demarcated by dotted line) groups for distant metastasis. (C) Kaplan-Meier survival plot for distant-metastasis-free survival stratified by high/low risk clusters were based on combined clinical and molecular patient features. (D) Representative images of two MCC samples from patients without and with distant metastasis (DM). Scale bars, 200μm. (E) Boxplot depicting CD8+ T frequencies in all patients stratified by occurrence of distant metastasis. Each point represents the mean cell frequency from all TMA cores sampled before distant metastasis per patient (n=26). (F) Kaplan-Meier plot for DMFS in patients that were dichotomized by median CD8+ T infiltration. Statistical significance was determined by log-rank test. (G) Lasso-regressed multivariate CoxPH model depicting variables significantly associated with DMFS amongst the collected clinical and molecular parameters from CODEX multiplex imaging. (H) Volcano plot illustrating genes significantly enriched in in patients with or without distant metastasis at a false-discovery rate (FDR) < 0.01 as assessed by LCM-seq. Green arrows indicate genes implicated in B-cell-driven immune responses or T cell activation. (I) Spatial context map revealing CN-CN interfaces stratified by patients with and without distant metastases. Dotted lines indicate unique spatial contexts that were only observed in patients with (center) or without (left) distant metastasis. Color-codes specified on the right. (J) Representative fluorescence image (left) with corresponding CN geography map (right) illustrating the spatial context involving the interaction of vessel-enriched CN8 with a CAF-enriched CN9 at the tumor boundary CN1. (K) Barycentric coordinate projection depicting the interactions between CN1-CN8-CN9 in patients without (top left) or with distant metastasis (bottom left), as well as corresponding Kaplan-Meier plot for DMFS in patients with high and low levels of CN1-CN9 intersection (right). Statistical significance was determined through log-rank test. Abbreviation: DM, distant metastasis.
Fig.6:
Fig.6:. CXCL9+ macrophages and CD8+ T cells are spatially co-enriched at the tumor invasive front of HPV-positive head-and-neck carcinoma.
(A) Conceptual and analytical framework for the investigation of the OPSCC patient cohort using CODEX multiplex imaging. (B) Summary of clinical patient characteristics of the investigated OPSCC patient cohort. (C) Kaplan-Meier survival plot for overall survival stratified within the OPSCC cohort separated by HPV-viral status. Statistical significance was determined using log-rank test. (D) Dotplot summarizing the mean log-normalized expression values of key phenotypic and functional markers amongst the classified cell-types within the CODEX dataset. (E) Waterfall plot depicting the mean log2-fold enrichment of major cell-types in HPV+ vs HPV− OPSCC patients. Statistical significance was determined using Wilcoxon-rank sum test corrected for multiple-hypothesis testing (BH). *p < 0.05, **p < 0.01. (F) Left: Heatmaps comparing the mean z-normalized expression of functional markers in selected cell-types between HPV− and HPV+ OPSCC samples, with corresponding total cell counts of each cell-type shown as barplots above. Non-significant differences in functional marker expression for a given cell-type between viral-status groups are indicted by dotted lines. Statistical significance was determined using Wilcoxon-rank sum test corrected for multiple hypothesis testing. (G) Representative examples illustrating the cellular composition of the TME in HPV+ vs HPV− OPSCC. Scale bars, 200μm. (H) Heatmap depicting the relative enrichment of cell-types within the identified OPSCC CNs compared to the global tissue average. CNs were computed using window sizes of k=15 nearest neighbors. (I) Boxplots depicting the relative enrichment of CD8+ and CD4+ T cells in the tumor boundary CN1 of HPV+ OPSCC (left and center); while CAFs were enriched in CN1 of HPV− OPSCC (right). Statistical significance was determined using Wilcoxon-rank sum test corrected for multiple hypothesis testing (BH). *p < 0.05, **p < 0.01, *** p<0.005. (J) Representative images depicting the enrichment of CD8+ T cells and CXCL9+ macrophages in CN1 of HPV+ HNSCC while in HPV− OPSCC CAFs were enriched in the tumor boundary CN1. Scale bar of 100μm applies to both panels. (K) Violinplots comparing the mean log-normalized expression of HLA-DR, CXCL9 and PD-L1 in macrophages of the tumor boundary CN1 between HPV+ and HPV− OPSCC. Statistical significance was determined using Wilcoxon-rank sum test corrected for multiple hypothesis testing (BH). *p < 0.05, **p < 0.01, *** p<0.005. (L) Violinplots comparing the mean log-normalized expression of HLA-DR, CXCL9 and PD-L1 in macrophages of the tumor boundary CN2 between HPV+ and HPV− OPSCC. Statistical significance was determined using Wilcoxon-rank sum test corrected for multiple hypothesis testing (BH). *p < 0.05, **p < 0.01, *** p<0.005.
Fig.7:
Fig.7:. Predominance of central memory CD8T-cells and B-cell enriched niches are shared features predicting response to ICB in VP and VN-MCC.
(A) MCC patient cohort used for investigation of predictive molecular biomarkers. (B) Summary of clinical patient characteristics of the investigated OPSCC patient cohort. (C) Boxplots depicting relative abundance of molecular features associated with ICB-response. Statistical significance was determined using Wilcoxon-rank sum test corrected for multiple-hypothesis testing (BH). *p < 0.05, **p < 0.01, *** p<0.005. (D) Lasso-regressed CoxPH model summarizing features significantly associated with PFS amongst the collected CODEX parameters and clinical parameters. (E) Representative cell-type geography maps highlighting enrichment of cellular features associating with ICB response. Scale bars, 300 μm. (F) Barplots summarizing the top10 and bottom 5 features sorted by log-fold change difference associating with ICB-response in VP-MCC patients (left) and VN-MCC patients (right). Statistical significance was determined using a generalized linear model from the glm-package in R. (G) Volcano plots of selected genes significantly enriched in ICB responders with FDR < 0.01 as assessed by LCM-seq. Genes implicated in TLS formation and antigen presentation pathways are highlighted. (H) Dotplot summarizing results gene-set enrichment analysis for ICB-responders with selected non-redundant top-20 gene sets shown (top). Bottom gene-set enrichment plot using the TLS imprint signature described in Meylan et al. . (I) Representative images highlighting characteristic TME composition and architectural features across VP and VN-MCC, that associate with ICB response. Scale bars, 200 μm. (J) Left: Representative multiplex immunofluorescence image of the spatial contexts unique to ICB-responders with corresponding CN-overlays. Right: Spatial context map depicts the enrichment of characteristic CN-interfaces in ICB-responders including the CN3-CN4-CN5 spatial context (highlighted in green box). Size of nodes depicts the relative abundance of these CN-CN interfaces amongst the overall dataset. (K) Left: Spatial context map depicts the enrichment of characteristic CN-interfaces in ICB-non-responders including the spatial context encompassing CN1-CN8-CN9 interfaces (highlighted in red box). Right: Representative multiplex IF image of the spatial context specified on the left unique to ICB-non-responders with corresponding CN-overlays. Color-codes as specified in Figure 7J–K apply. (L) Cartoon depicting key differences between the VN and VP-MCC TME that results in differential risk for distant metastasis (top). Despite these distinct TME compositions, VN and VP-MCC share cellular and architectural features that predict ICB response (bottom). Abbreviations. PD, progressive disease; PR, partial response; CR, complete response; R, response; NR, no response; ICB, immune checkpoint blockade; Tcm, central memory CD8T cells; PFS = progression-free survival; cDC1 = conventional dendritic cell type 1.

Similar articles

References

    1. Becker J.C., et al. Merkel cell carcinoma. Nat Rev Dis Primers 3, 17077 (2017). - PMC - PubMed
    1. Lewis C.W., et al. Patterns of distant metastases in 215 Merkel cell carcinoma patients: Implications for prognosis and surveillance. Cancer Med 9, 1374–1382 (2020). - PMC - PubMed
    1. Feng H., Shuda M., Chang Y. & Moore P.S. Clonal integration of a polyomavirus in human Merkel cell carcinoma. Science 319, 1096–1100 (2008). - PMC - PubMed
    1. Harms K.L., et al. Virus-positive Merkel Cell Carcinoma Is an Independent Prognostic Group with Distinct Predictive Biomarkers. Clin Cancer Res 27, 2494–2504 (2021). - PMC - PubMed
    1. Moshiri A.S., et al. Polyomavirus-Negative Merkel Cell Carcinoma: A More Aggressive Subtype Based on Analysis of 282 Cases Using Multimodal Tumor Virus Detection. J Invest Dermatol 137, 819–827 (2017). - PMC - PubMed

Publication types