[Preprint]. 2025 Jun 1:2025.05.28.656580.
doi: 10.1101/2025.05.28.656580.

The SHR/Akr Y chromosome reveals repeated turnover of the rat pseudoautosomal region

Affiliations

The SHR/Akr Y chromosome reveals repeated turnover of the rat pseudoautosomal region

Daniel W Bellott et al. bioRxiv. .

Abstract

Crossing-over between Chr X and Chr Y was first observed 90 years ago, in the brown rat, Rattus norvegicus. However, the sequence of the rat pseudoautosomal region (PAR) has remained a mystery. We produced a near-complete sequence of Chr Y from the SHR strain, along with nearly a megabase of sequence from both telomeres of Chr X. Both telomeric ends of Chr Y display extensive homology to Chr X, but no homology to the ancestral PAR of placental mammals. Using rat Y BACs probes for FISH on meiotic cells, we show that pairing almost always occurs between the tips of Yq and Xp, which are virtually identical in nucleotide sequence, but contain no protein-coding genes. Homology at the other ends of Chr X and Chr Y is likely the result of a recent transposition of five genes from Xq to Yp. These sequences are only 99.5% identical and pair infrequently, but show signs that it may have been pseudoautosomal in the ancestor of the rat genus. The rat Chr Y sequence presents opportunities for experimental studies of meiotic phenomena in a tractable model organism. The short PAR, with a correspondingly high recombination rate, represents a unique substrate for molecular studies of crossing-over. Likewise, the absence of extensively co-amplified testis gene families on the rat X and Y suggests they might serve as control for the intense competition between selfish elements that completely remodeled the mouse sex chromosomes.


Conflict of interest statement

Competing Interests The authors declare no competing interests.

Figures
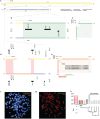
Figure 1:
Figure 1:. Structure of the rat sex chromosomes and pseudoautosomal region
(a) Schematic representation of rat Chr X and Chr Y, showing the whole of each chromosome, including the PAR. Shading indicates five classes of euchromatic sequence, as well as heterochromatic sequences. Colored arcs represent regions of >95% X-Y sequence identity. Scale bar, 10 Mb. (b) Distal 350 kb from the short arm of Chr X and long arm of Chr Y, enlarged to show PAR. Dashed line: PAB. Boxes, transcripts in PAR. Scale bar, 100 kb. (c) Square dot plot comparing the distal tip of the Y long arm to the X short arm. Each dot represents 100% identity in a 50-bp window. Above, graph of percent X-Y identity in 1-kb sliding window. (d) Distal 700kb from the long arm of the X and short arm of the Y, enlarged to show XTR. Boxes, transcripts on NPY and NPX. Scale bar, 100kb. (e) Square dot plot comparing the distal tip of the Y short arm to the X long arm. Each dot represents 100% identity in a 50-bp window. Above, graph of percent X-Y identity in 1-kb sliding window. (f) FISH with X-transposed region BAC probes CH230–344F11 (green) and CH230–331N23 (red) on mitotic metaphase chromosomes stained with DAPI (blue). Purple arrowhead, Chr Y; orange arrowhead, Chr X. (g) FISH with X-transposed region BAC probe CH230–344F11 (green) on meiotic prophase chromosomes of clone 9 (CRL-1439) cells, and anti-SCP3 antibody (red). Purple arrowhead, Chr Y; orange arrowhead, Chr X; green arrowhead, PAR. (h) Bar graph comparing GC content across regions of rat (RNO) genome against XTR orthologs in closely-related rodents: RRA, Rattus rattus; MMI, Micromys minutis; MMU, Mus musculus; AAG, Apodemus agrarius; CCR, Cricetus cricetus. Below, phylogenetic tree after Steppan and Schenk 2017 showing relationships between species.
Figure 2:
Figure 2:. Comparison with other placental Y chromosomes
(a) Triangular dot plot. Each dot represents 100% identity in a 250-bp window between two sequences on the rat Y. Schematic representation of rat Chr Y, showing the whole of each chromosome, including the location of the largest amplicon and the main Ssty array. Shading indicates five classes of euchromatic sequence, as well as heterochromatic sequences. (b) Triangular dot plot and schematic of mouse Chr Y. (c) Square dot plot comparing the rat and mouse short arms. Each dot represents 100% identity in a 25-bp window. Boxes, transcripts on rat and mouse NPYs. Scale bar 100kb. (d) Phylogenetic tree of the relationships between analyzed Y chromosomes. (e) Bar chart of Chr Y gene density (genes / Mb) of the species in (d). (f) Grouped bar chart of interspersed repeat classes.
Figure 3:
Figure 3:. Structure of the rat Y short arm
(a) Triangular dot plot. Each dot represents 100% identity in a 250-bp window between two sequences on the rat Y. Schematic representation of the rat Y short arm. Shading indicates four classes of euchromatic sequence, as well as heterochromatic sequences. Scale bar 100kb. (b) Boxes, protein-coding transcripts on rat Y short arm.
Figure 4:
Figure 4:. The ampliconic Ssty gene family
(a) Schematic representation of Chr Y from rat and mouse. Shading indicates five classes of euchromatic sequence, as well as heterochromatic sequences. Vertical bars indicate locations of ampliconic genes. Scale bar 10 Mb. (b) Triangular dot plot of the main rat Ssty array. Each dot represents 100% identity in a 250-bp window between two sequences on the rat Y. Scale bar 500kb. (c) Maximum-likelihood tree of selected Ssty family members and spindlin family homologs in placental mammals; gene names shaded by chromosomal location: purple, NPY; orange, NPX; grey, autosomal. (d) FISH with autosomal Sstyl-region BAC probe RNECO-200B10 (red) on mitotic metaphase chromosomes stained with DAPI (blue). Purple arrowhead, chrY; grey arrowhead, autosome.
Figure 5:
Figure 5:. Expression of rat Y genes and their X and autosomal homologs
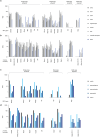
Expression of (a) Y genes and their (b) X and autosomal homologs in various adult tissues, as well as selected (c) Y genes and their (d) X and autosomal homologs in cell fractions of adult testes, as measured by RNA sequencing. For multi-copy and ampliconic genes, expression is the sum across all copies.

References

    1. Arlt MF, Brogley MA, Stark-Dykema ER, Hu Y-C, Mueller JL. 2020. Genomic Structure, Evolutionary Origins, and Reproductive Function of a Large Amplified Intrinsically Disordered Protein-Coding Gene on the X Chromosome (Laidx) in Mice. G3 10: 1997–2005. - PMC - PubMed
    1. Bellott DW, Cho T-J, Hughes JF, Skaletsky H, Page DC. 2018. Cost-Effective High-Throughput Single-Haplotype Iterative Mapping and Sequencing for Complex Genomic Structures. Nat Protoc 13: 787–809. - PMC - PubMed
    1. Bellott DW, Cho T-J, Jackson EK, Skaletsky H, Hughes JF, Page DC. 2022. SHIMS 3.0: Highly efficient single-haplotype iterative mapping and sequencing using ultra-long nanopore reads ed. O.P. Perera. PLoS One 17: e0269692. - PMC - PubMed
    1. Bellott DW, Hughes JF, Skaletsky H, Brown LG, Pyntikova T, Cho T-J, Koutseva N, Zaghlul S, Graves T, Rock S, et al. 2014. Mammalian Y Chromosomes Retain Widely Expressed Dosage-Sensitive Regulators. Nature 508: 494–499. - PMC - PubMed
    1. Bellott DW, Skaletsky H, Cho T-J, Brown L, Locke D, Chen N, Galkina S, Pyntikova T, Koutseva N, Graves T, et al. 2017. Avian W and Mammalian Y Chromosomes Convergently Retained Dosage-Sensitive Regulators. Nat Genet 49: 387–394. - PMC - PubMed

Publication types

LinkOut - more resources