[Preprint]. 2025 Jun 2:2024.06.14.599122.
doi: 10.1101/2024.06.14.599122.

A haplotype-resolved view of human gene regulation

Affiliations

A haplotype-resolved view of human gene regulation

Mitchell R Vollger et al. bioRxiv. .

Abstract

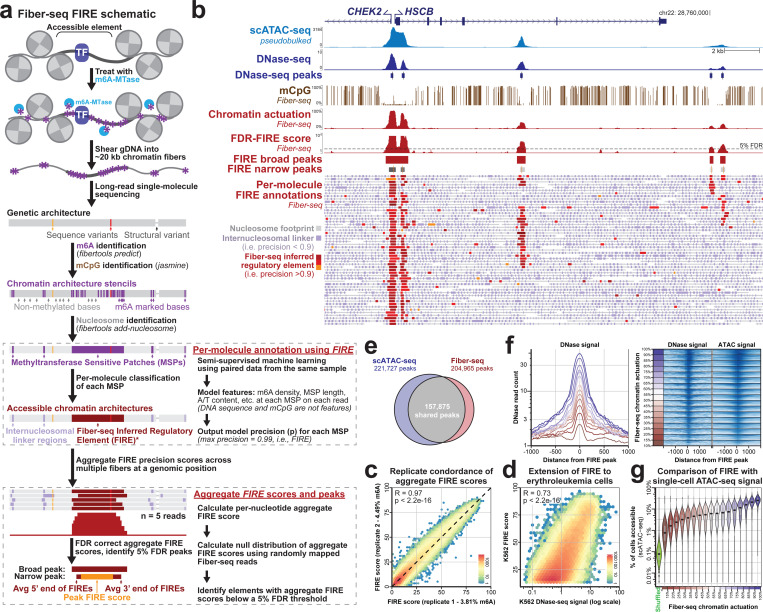
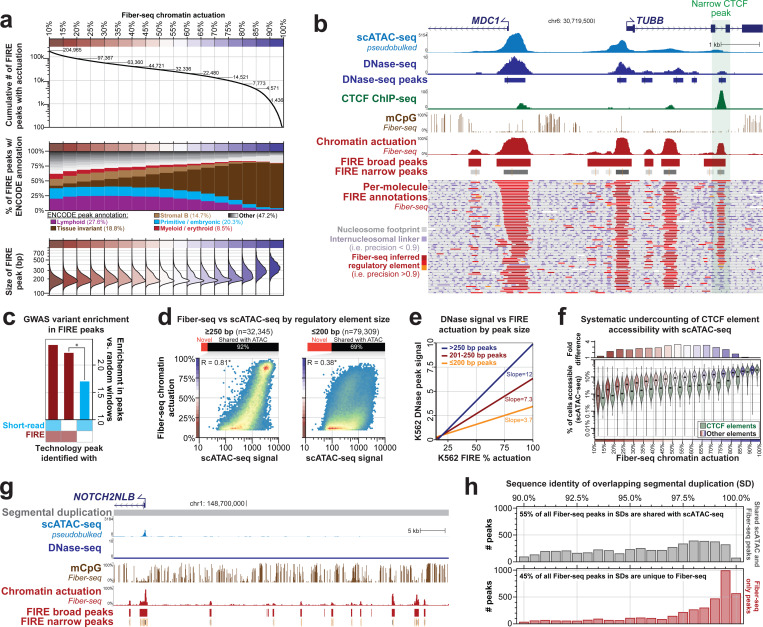
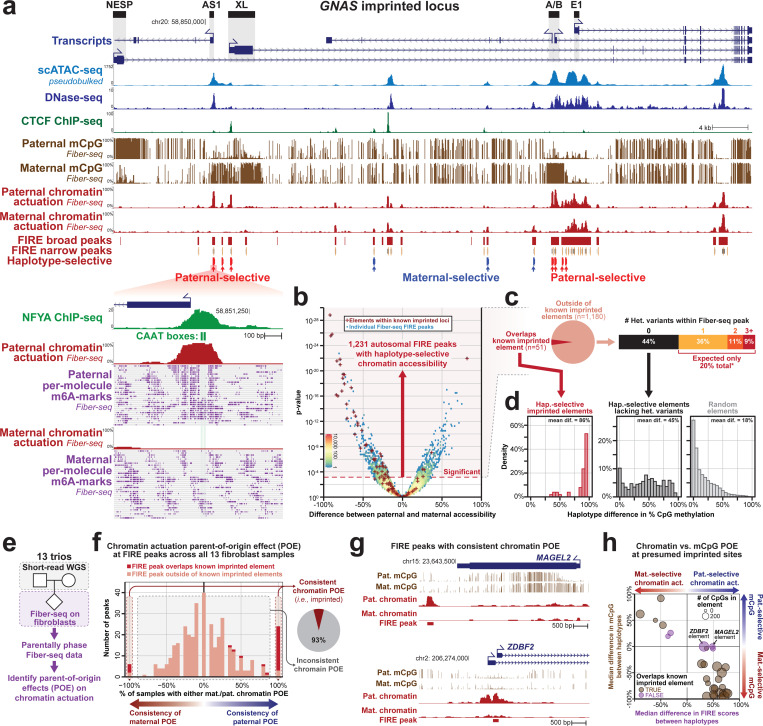
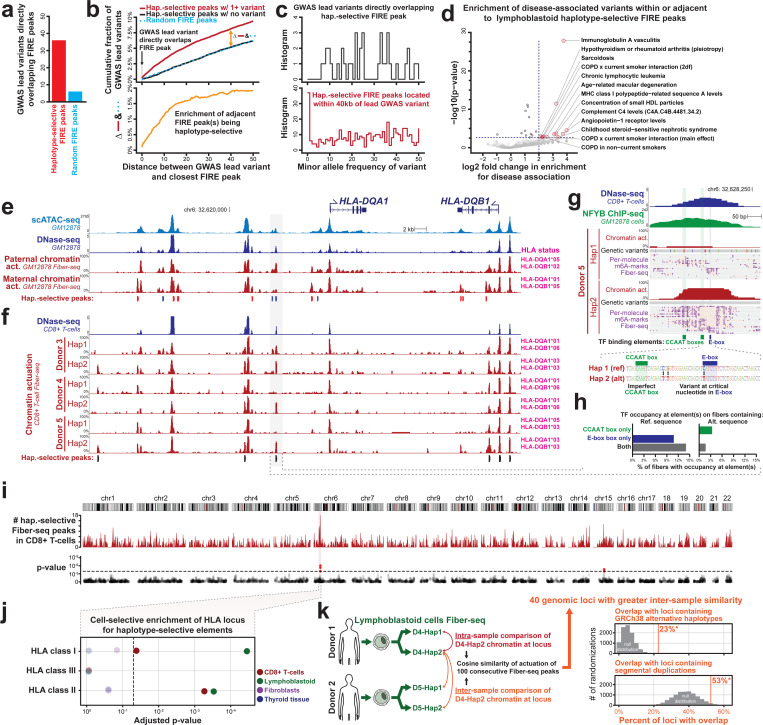
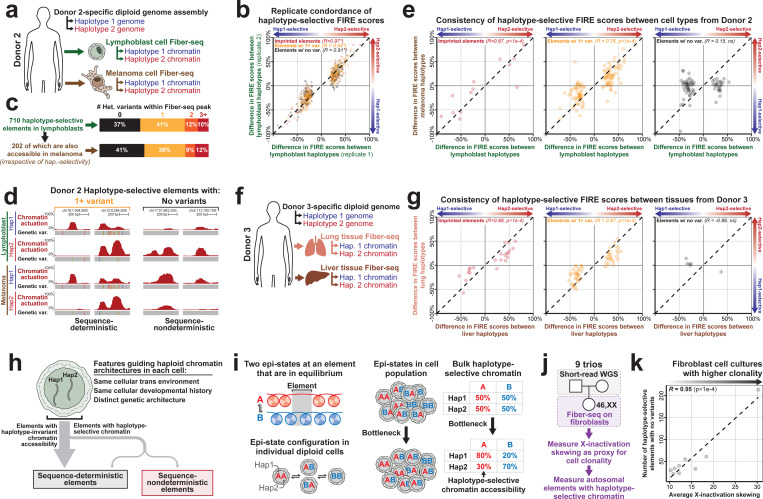
Diploid human cells contain two non-identical genomes, and differences in their regulation underlie human development and disease. We present Fiber-seq Inferred Regulatory Elements (FIRE) and show that FIRE provides a more comprehensive and quantitative snapshot of the accessible chromatin landscape across the 6 Gbp diploid human genome, overcoming previously known and unknown biases afflicting our existing regulatory element catalog. FIRE provides a comprehensive genome-wide map of haplotype-selective chromatin accessibility (HSCA), exposing novel imprinted elements that lack underlying parent-of-origin CpG methylation differences, common and rare genetic variants that disrupt gene regulatory patterns, gene regulatory modules that enable genes to escape X chromosome inactivation, and autosomal mitotically stable somatic epimutations. We find that the human leukocyte antigen (HLA) locus harbors the most HSCA in immune cells, and we resolve the specific transcription factor (TF) binding events disrupted by disease-associated variants within the HLA locus. Finally, we demonstrate that the regulatory landscape of a cell is littered with autosomal somatic epimutations that are propagated by clonal expansions to create mitotically stable and non-genetically deterministic chromatin alterations.


Conflict of interest statement

Competing interests A.B.S. is a co-inventor on a patent relating to the Fiber-seq method (US17/995,058).

Figures

Figure 1.
Figure 1.. Fiber-seq Inferred Regulatory Elements and benchmarking against existing chromatin accessibility measures.
a) A schematic of Fiber-seq experimental and computational processing, including the identification of Fiber-seq Inferred Regulatory Elements (FIREs). b) Genomic locus comparing the relationship between scATAC–seq, DNase–seq, mCpG, FIRE percent chromatin actuation, and FIRE peaks in GM12878. Below are individual Fiber-seq reads with MTase Sensitive Patches (MSPs) marked in purple, nucleosomes marked in gray, and FIRE elements marked in red. White regions separate individual reads. c) Correlation of FIRE score within the peaks of two technical replicates of COLO829BL (two-sided t-test). d) Correlation of FIRE score with bulk DNase-seq in K562 accessible peaks (two-sided t-test). e) Venn diagram showing the overlap of FIRE and scATAC peaks in GM12878. f) (Left) Average count of DNase I reads over FIRE peaks binned by their percent actuation (red-blue color scale). (Right) Percentile normalized scATAC and DNase I signal for 100 random FIRE peaks across each percent actuation bin. g) Comparison of percent actuation quantified by Fiber-seq and scATAC-seq. scATAC-seq accessibility values represent the fraction of single cells with at least one sequenced fragment overlapping the respective peak. FIRE peaks are binned by Fiber-seq percent actuation (left) and scATAC-seq percent actuation (right).
Figure 2.
Figure 2.. Chromatin features within FIRE-specific peaks.
a) Features of FIRE peaks binned by percent actuation. b) Genomic locus comparing the relationship between scATAC-seq, DNase–seq, mCpG, CTCF ChIP-seq, FIRE percent chromatin actuation, and FIRE peaks in GM12878. A representative CTCF site with greater accessibility in Fiber-seq data than scATAC-seq and DNase–seq is highlighted in green (right). c) Per-base enrichment of GWAS variants within shared peaks between FIRE and DNase/scATAC, FIRE only peaks, and peaks unique to DNase or scATAC as compared to shuffled random windows of the same size (p-value = 1.32e-17, two-sided Fisher’s exact test). d) Correlation of FIRE percent actuation and scATAC-seq signal within FIRE peaks faceted by FIRE peak size (Pearson’s correlation; p < 2.2e−16 two-sided t-test). e) Prediction of percent FIRE actuation from DNase peak as signal using a linear model for different bins of FIRE peak size. f) Comparison of scATAC-seq signal to FIRE in peaks with (green) and without (red-blue) CTCF ChIP-seq peaks. g) Genomic locus of NOTCH2NLB comparing the ability to map into repetitive regions between scATAC-seq, DNase–seq, and Fiber-seq. h) FIRE peaks within segmental duplications stratified by the sequence identity of the underlying segmental duplication. FIRE peaks with a shared scATAC-seq peak are colored in gray, and peaks unique to FIRE are colored in red.
Figure 3.
Figure 3.. Haplotype-selective chromatin accessibility.
a) The GNAS imprinted locus comparing the relationship between GNAS isoforms, scATAC-seq, DNase–seq, CTCF ChIP-seq, NFYA ChIP-seq, mCpG, FIRE percent actuation, FIRE peaks, and maternally (blue) or paternally (red) haplotype-selective FIRE peaks in GM12878. Fiber-seq captures haplotype-selective chromatin architectures in both mCpG and chromatin actuation. b) Difference between maternal and paternal accessibility for FIRE haplotype-selective peaks stratified by p-value (two-sided Fisher’s exact test). The dashed line indicates genome-wide significance after applying a 5% FDR correction (Benjamini-Hochberg), and the red plus marks indicate known imprinted sites. c) Stratification of haplotype-selective peaks by imprinting status and the number of genetic variants within each peak. d) Histogram of the haplotype differences in percent CpG methylation for haplotype-selective peaks within imprinted sites, sites without genetic variants, and non-haplotype-selective peaks. e) Schematic of sequencing 13 trios with parental short-reads for phasing and Fiber-seq on the probands to identify parent of origin effects (POE) in chromatin. f) Distribution of haplotype-selective chromatin accessibility (HSCA) peaks showing the fraction of fibroblast samples with consistent maternal or paternal bias. Dark red in the histogram indicates previously identified imprinted sites; the pie chart shows the proportion of sites with consistent POE. g) Browser views of two genomic regions (MAGEL2 and ZDBF2) demonstrating consistent POE in fibroblasts. h) Relationship between parental bias in CpG methylation (y-axis) and FIRE actuation (x-axis). Purple points represent new imprinted sites, with three showing consistent POE in FIRE without evidence of differential CpG methylation.
Figure 4.
Figure 4.. Haplotype-selective chromatin in the major histocompatibility complex.
a) The number of haplotype-selective peaks (red) or random windows (blue) in GM12878 that overlap GWAS variants that are heterozygous in GM12878. b) Top, the fraction of lead GWAS variants that can be found within a specific distance (kbp) of: a haplotype selective peak with a genetic variant (red), a haplotype selective peak without genetic variants, and a random set of FIRE peaks of the same size. Bottom, the difference in the fraction of GWAS within a specific distance to a haplotype selective variant with a genetic variant versus a random set of FIRE peaks of the same size. c) Enrichment of disease-associated variants within 40 kbp of haplotype-selective FIRE peaks for different disease associations. The x-axis shows the log2 fold enrichment, and the y-axis represents the p-value of a two-sided Fisher’s exact test. e) GM12878 haplotype-selective sites in the HLA-DQA1/HLA-DQB1 locus. f) Haplotype-selective sites in the HLA-DQA1/HLA-DQB1 locus for CD8+ T-cells sequenced to ~30-fold coverage across three individuals. g) Haplotype-selective Fiber-seq patterns showing disruption of single-molecule Fiber-seq TF occupancy and chromatin actuation in Donor 5 due to the underlying haplotype. h) Histogram of the percent of fibers with TF occupancy at the CCAAT box and E-box across both haplotypes of Donor 5. i) Ideogram of the number of haplotype-selective sites in high-coverage CD8+ T-cells and the two-sided Fisher’s exact significance of the enrichment of haplotype-selective chromatin (Methods). j) Cell-selective enrichment of HLA class I, II, and III for haplotype-selective elements (two-sided Fisher’s exact test). k) Schematic of testing intra-versus inter-sample cosine similarity between four haplotypes from two donors (GM12878 and COLO829BL) and enrichment of inter-sample similarity within GRCh38 alternative haplotypes (p < 1e-04; permutation test n=10,000; Methods) and segmental duplications (p = 0.0357; permutation test n=10,000; Methods).
Figure 5.
Figure 5.. Deviation of haplotype-selective chromatin across cell types.
a) Schematic of the sequencing of donor 2 of lymphoblast and melanoma cell lines. b) Replicate concordance of haplotype-selective percent actuation difference across two lymphoblast replicates for imprinted elements (red), elements with genetic variants between haplotypes (orange), and elements without genetic variants (black). Shown is the Pearson’s correlation; all correlations are significant with p < 2.2e−16 (two-sided t-test). c) The overlap of 710 lymphoblast haplotype-selective peaks with genetic variants and the subset of those peaks (202) that also overlap peaks within the melanoma cell line. d) Example of shared haplotype-selective elements and unique haplotype-selective elements between lymphoblast and melanoma cells. e) Concordance of haplotype-selective peaks between lymphoblast and melanoma cells within imprinted sites, sites with genetic variants, and sites without genetic variants (Pearson’s correlation; two-sided t-test: left p = 1e-4, middle p < 2.2e−16, right p = 0.21). f) Experimental design showing sequencing of liver and lung primary tissues from donor 3. g) Comparison of haplotype-selective peak concordance between liver and lung primary tissues, analyzed as in panel e. h) Conceptual model distinguishing haplotype-invariant elements from haplotype-selective elements with deterministic and non-deterministic patterns. i) Model illustrating how population bottlenecking in cell populations may generate additional haplotype-selective chromatin accessibility. j) Experimental approach for sequencing nine female fibroblast cell lines, using X-inactivation allelic skewing as a proxy for cell clonality. k) Correlation analysis between the number of haplotype-selective FIRE peaks without genetic variants and the average allelic skew across all X chromosome promoters, excluding the pseudoautosomal regions (Pearson’s correlation; two-sided t-test p-value = 7.9e−05).
Figure 6.
Figure 6.. Haplotype-specific features of X chromosome inactivation (XCI).
a) Schematic of culture-derived XCI skewing. b) Chromosome-wide comparison between percent actuation of the paternal (Xa) and maternal (Xi) haplotypes at each FIRE peak in LCL cells (GM12878). Pseudoautosomal regions (PAR1 & PAR2) are highlighted in orange and gray, respectively. c) Counts of FIRE peaks categorized as Xa-specific, Xi-specific, or Shared between both haplotypes for LCL (top) and fibroblast cells (bottom). FIRE elements are stratified by their location within or outside of PAR1 (left), and non-PAR1 elements are further subsetted to those that overlap a CTCF site (middle) or TSS (right). d) Scatterplot of LCL Fiber-seq percent actuation on the Xi (x-axis) and Xa (y-axis) for each TSS. Points are colored by XCI escape annotations from previous studies (65). e) UBA1 promoter region comparing full-length transcript reads, scATAC-seq, CTCF ChIP-seq, mCpG, FIRE percent actuation, FIRE peaks, and representative Fiber-seq reads from the paternal (Xa) and maternal (Xi) haplotypes in LCLs (GM12878). f) Scatterplot of Fiber-seq percent actuation on the Xi in LCL (x-axis) and fibroblast (y-axis) cells. Points are colored as in panel d. g) The average number of escaping non-TSS FIRE peaks in LCL (left) and fibroblast (right) cells by absolute distance from TSSs. Counts are displayed separately for escaping TSSs (top, purple) and inactivated TSSs (bottom, blue). h) Full-length LCL transcript expression differences between the Xa and Xi for genes phased by Fiber-seq and displayed in d. Count differences are displayed as log2 fold-change between the haplotypes. Genes are stratified by the Fiber-seq classifications of their TSS FIRE peaks as in c. i) The number of escaping LCL non-TSS FIRE peaks within 5 Kb of each TSS in the shared category in h. Shared TSSs were grouped into high or low log2 fold-change in expression, highlighted with blue and purple in h (*p = 0.04031; one-sided Wilcoxon rank sum test).

References

    1. Jain M., Olsen H. E., Turner D. J., Stoddart D., Bulazel K. V., Paten B., Haussler D., Willard H. F., Akeson M., Miga K. H., Linear assembly of a human centromere on the Y chromosome. Nat. Biotechnol. 36, 321–323 (2018). - PMC - PubMed
    1. Wenger A. M., Peluso P., Rowell W. J., Chang P.-C., Hall R. J., Concepcion G. T., Ebler J., Fungtammasan A., Kolesnikov A., Olson N. D., Töpfer A., Alonge M., Mahmoud M., Qian Y., Chin C.-S., Phillippy A. M., Schatz M. C., Myers G., DePristo M. A., Ruan J., Marschall T., Sedlazeck F. J., Zook J. M., Li H., Koren S., Carroll A., Rank D. R., Hunkapiller M. W., Accurate circular consensus long-read sequencing improves variant detection and assembly of a human genome. Nat. Biotechnol., doi: 10.1038/s41587-019-0217-9 (2019). - DOI - PMC - PubMed
    1. Cheng H., Concepcion G. T., Feng X., Zhang H., Li H., Haplotype-resolved de novo assembly using phased assembly graphs with hifiasm. Nat. Methods 18, 170–175 (2021). - PMC - PubMed
    1. Rautiainen M., Nurk S., Walenz B. P., Logsdon G. A., Porubsky D., Rhie A., Eichler E. E., Phillippy A. M., Koren S., Telomere-to-telomere assembly of diploid chromosomes with Verkko. Nat. Biotechnol. 41, 1474–1482 (2023). - PMC - PubMed
    1. Miga K. H., Koren S., Rhie A., Vollger M. R., Gershman A., Bzikadze A., Brooks S., Howe E., Porubsky D., Logsdon G. A., Schneider V. A., Potapova T., Wood J., Chow W., Armstrong J., Fredrickson J., Pak E., Tigyi K., Kremitzki M., Markovic C., Maduro V., Dutra A., Bouffard G. G., Chang A. M., Hansen N. F., Wilfert A. B., Thibaud-Nissen F., Schmitt A. D., Belton J.-M., Selvaraj S., Dennis M. Y., Soto D. C., Sahasrabudhe R., Kaya G., Quick J., Loman N. J., Holmes N., Loose M., Surti U., Risques R. A., Graves Lindsay T. A., Fulton R., Hall I., Paten B., Howe K., Timp W., Young A., Mullikin J. C., Pevzner P. A., Gerton J. L., Sullivan B. A., Eichler E. E., Phillippy A. M., Telomere-to-telomere assembly of a complete human X chromosome. Nature 585, 79–84 (2020). - PMC - PubMed

Publication types