This is a preprint.
Spine-Prints: Transposing Brain Fingerprints to the Spinal Cord
- PMID: 40501925
- PMCID: PMC12157566
- DOI: 10.1101/2025.05.30.656545
Spine-Prints: Transposing Brain Fingerprints to the Spinal Cord
Abstract
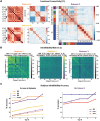
Functional connectivity (FC) patterns in the human brain form a reproducible, individual-specific "fingerprint" that allows reliable identification of the same participant across scans acquired over different sessions. While brain fingerprinting is robust across healthy individuals and neuroimaging modalities, little is known about whether the fingerprinting principle extends beyond the brain. Here, we used multiple spinal functional magnetic resonance imaging (fMRI) datasets acquired at different sites to examine whether a fingerprint can be revealed from FCs of the cervical region of the human spinal cord. Our results demonstrate that the functional organisation of the cervical spinal cord also exhibits individual-specific properties, suggesting the potential existence of a spine-print within the same acquisition session. This study provides the first evidence of a spinal cord connectivity fingerprint, underscoring the importance of considering a more comprehensive view of the entire central nervous system. Eventually, these spine-specific signatures could contribute to identifying individualized biomarkers of neuronal connectivity, with potential clinical applications in neurology and neurosurgery.
Keywords: brain fingerprinting; fMRI; functional connectivity; inter-subject variability; spinal cord imaging.
Figures


Similar articles
-
Prescription of Controlled Substances: Benefits and Risks.2025 Jul 6. In: StatPearls [Internet]. Treasure Island (FL): StatPearls Publishing; 2025 Jan–. 2025 Jul 6. In: StatPearls [Internet]. Treasure Island (FL): StatPearls Publishing; 2025 Jan–. PMID: 30726003 Free Books & Documents.
-
A Comprehensive and Modality Diverse Cervical Spine and Back Musculoskeletal Physical Exam Curriculum for Medical Students.J Educ Teach Emerg Med. 2025 Jul 31;10(3):SG1-SG8. doi: 10.21980/J8RQ0N. eCollection 2025 Jul. J Educ Teach Emerg Med. 2025. PMID: 40766941 Free PMC article.
-
MarkVCID cerebral small vessel consortium: I. Enrollment, clinical, fluid protocols.Alzheimers Dement. 2021 Apr;17(4):704-715. doi: 10.1002/alz.12215. Epub 2021 Jan 21. Alzheimers Dement. 2021. PMID: 33480172 Free PMC article.
-
Translating state-of-the-art spinal cord MRI techniques to clinical use: A systematic review of clinical studies utilizing DTI, MT, MWF, MRS, and fMRI.Neuroimage Clin. 2015 Dec 4;10:192-238. doi: 10.1016/j.nicl.2015.11.019. eCollection 2016. Neuroimage Clin. 2015. PMID: 26862478 Free PMC article.
-
Management of faecal incontinence and constipation in adults with central neurological diseases.Cochrane Database Syst Rev. 2014 Jan 13;2014(1):CD002115. doi: 10.1002/14651858.CD002115.pub5. Cochrane Database Syst Rev. 2014. Update in: Cochrane Database Syst Rev. 2024 Oct 29;10:CD002115. doi: 10.1002/14651858.CD002115.pub6. PMID: 24420006 Free PMC article. Updated.
References
-
- Cicchetti D. V., and Sparrow S. A.. 1981. “Developing Criteria for Establishing Interrater Reliability of Specific Items: Applications to Assessment of Adaptive Behavior.” American Journal of Mental Deficiency 86 (2): 127–37. - PubMed
Publication types
Grants and funding
LinkOut - more resources
Full Text Sources
