

This is a preprint.
Single-cell transcriptomics showed that maternal PCB exposure dysregulated ER stress-mediated cell type-specific responses in the liver of female offspring
- PMID: 40501930
- PMCID: PMC12157533
- DOI: 10.1101/2025.06.04.657944
Single-cell transcriptomics showed that maternal PCB exposure dysregulated ER stress-mediated cell type-specific responses in the liver of female offspring
Abstract
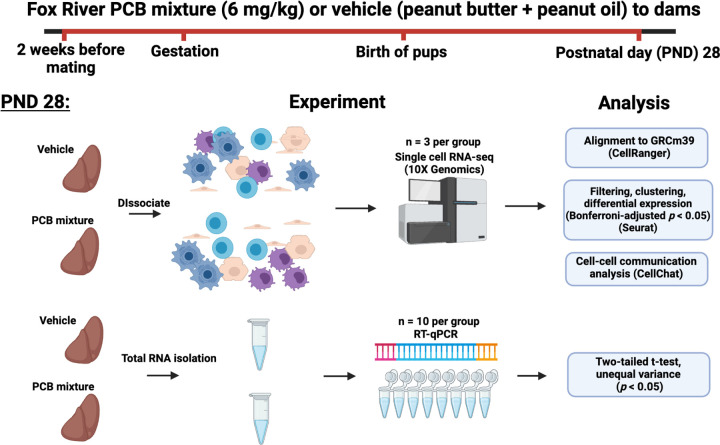
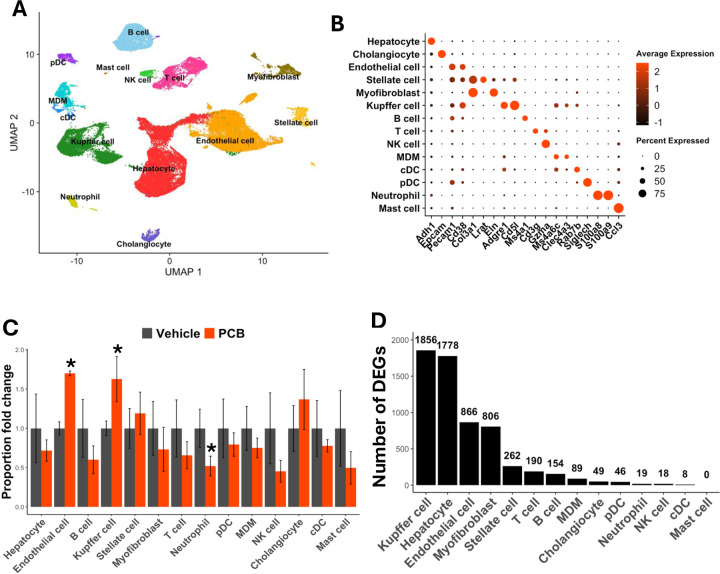
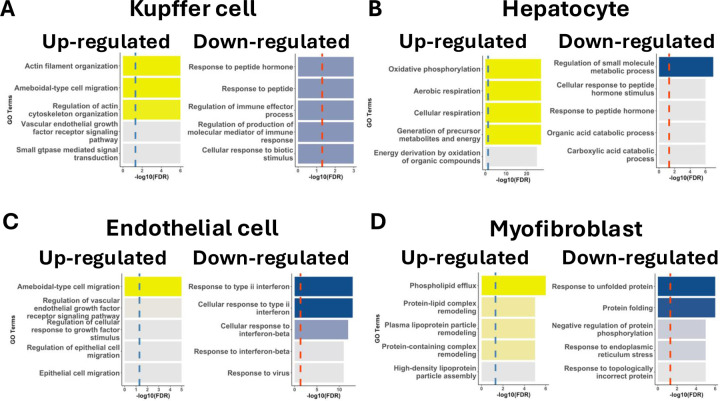
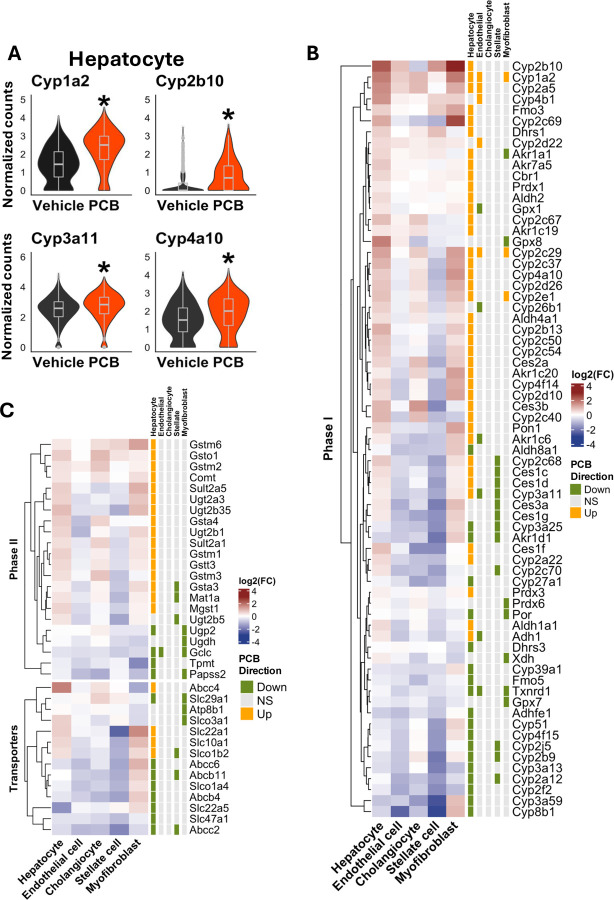
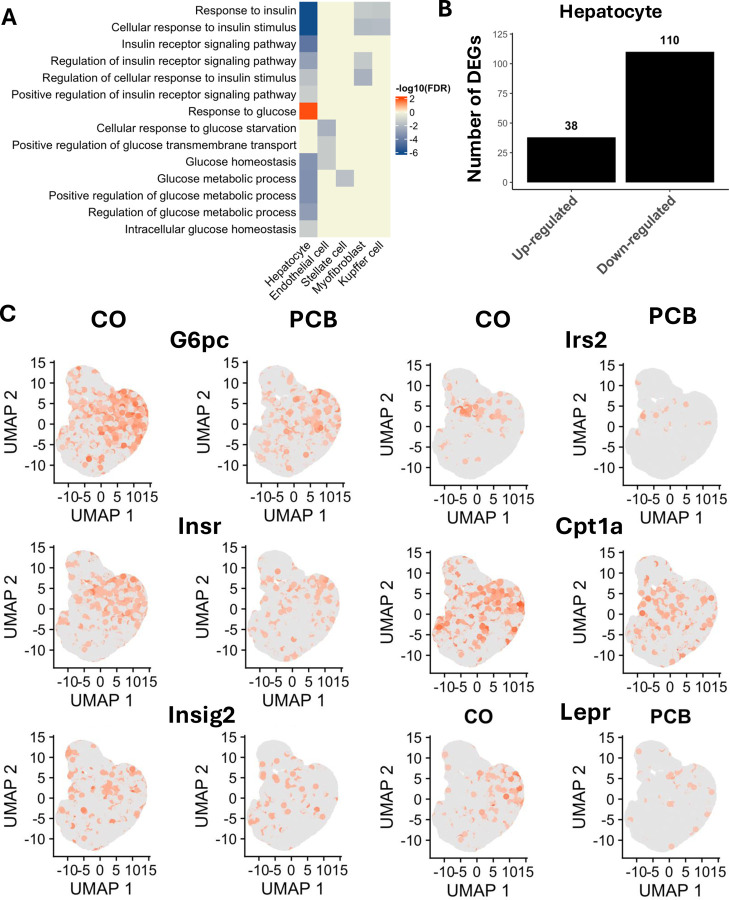
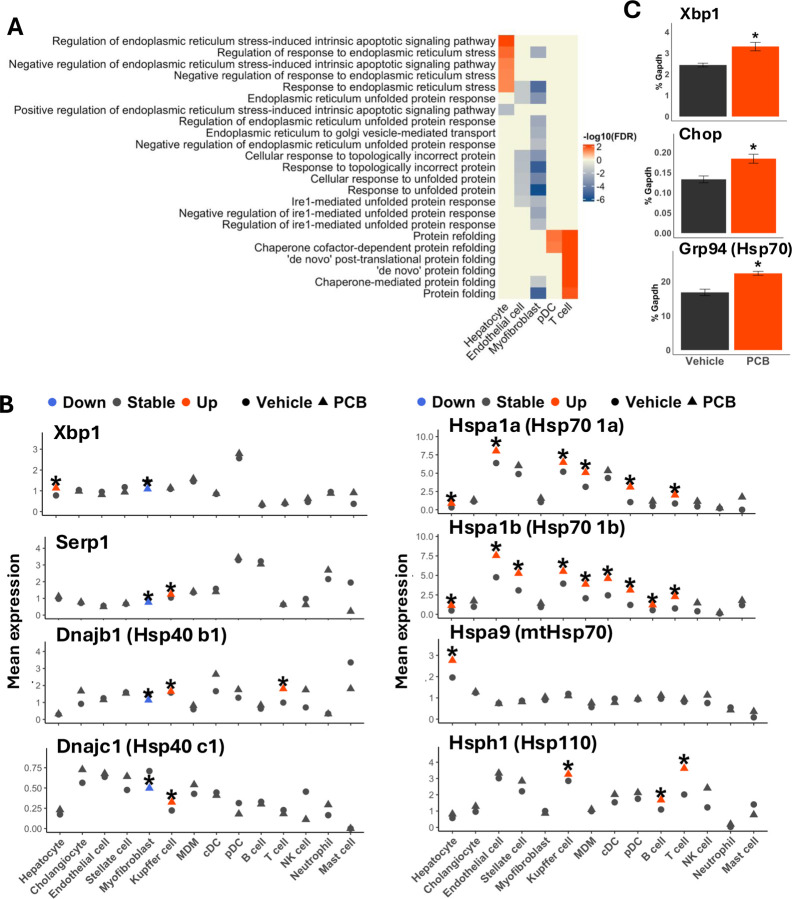
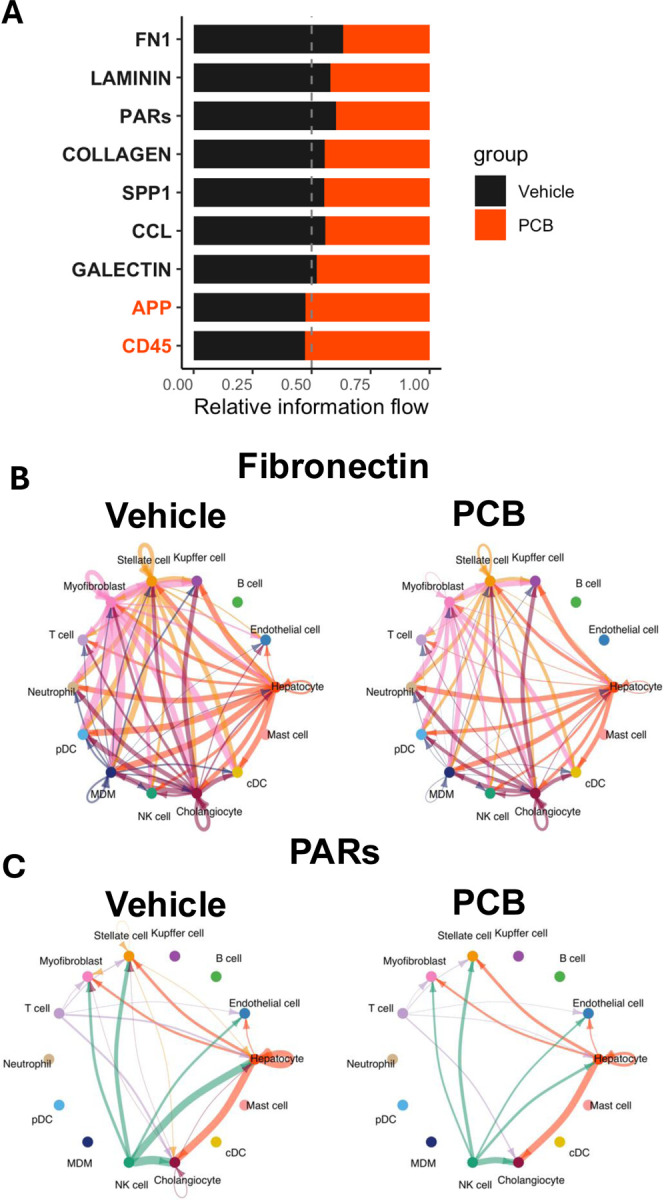
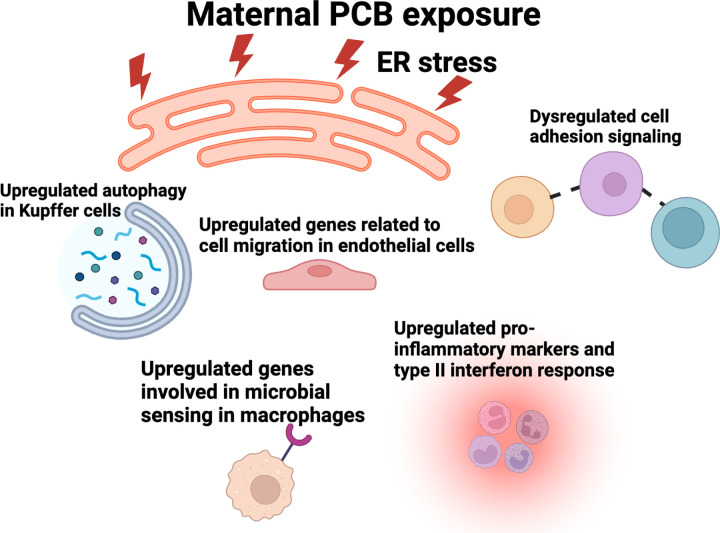
Polychlorinated biphenyls (PCBs) are persistent environmental toxicants that bioaccumulate in the food chain and readily cross the placenta, raising concerns for developmental toxicity. While PCB exposure has been associated with metabolic and neurodevelopmental disorders, its cell type-specific effects on liver development remain poorly understood. This study aimed to investigate how maternal exposure to an environmentally relevant Fox River PCB mixture affects liver development in female offspring at single-cell resolution. We hypothesized that early-life PCB exposure disrupts hepatic metabolic and immune function in a cell type-specific manner. Using single-cell RNA sequencing (scRNA-seq) on liver tissue from postnatal day 28 female mice perinatally exposed to PCBs, we identified major hepatic and immune cell populations and assessed cell-specific transcriptional responses. PCB exposure significantly altered the proportions of endothelial cells and Kupffer cells and reduced neutrophil abundance. Transcriptomic analysis revealed that PCBs dysregulated key pathways in hepatocytes and non-parenchymal cells, including ER stress responses, drug metabolism, and glucose/insulin signaling. Notably, hepatocytes exhibited upregulation of phase-I drug-metabolizing enzymes and uptake transporters, but downregulation of phase-II enzymes and efflux transporters. Kupffer cells and endothelial cells had altered immune and metabolic gene expression, and intercellular communication analysis predicted disrupted fibronectin, collagen, and chemokine signaling due to PCB exposure. RT-qPCR validation confirmed increased hepatic ER stress marker expression. Together these findings demonstrate that perinatal PCB exposure induces persistent, cell type-specific transcriptomic reprogramming in the liver, impairing metabolic and immune functions. This study highlights the utility of single-cell transcriptomics for revealing toxicant effects with cellular precision during critical windows of development.
Figures
Similar articles
-
Spatial transcriptomic profiling uncovers the molecular effects of the neurotoxicant polychlorinated biphenyls (PCBs) in the brains of adult mice.bioRxiv [Preprint]. 2025 Jul 26:2025.07.24.665575. doi: 10.1101/2025.07.24.665575. bioRxiv. 2025. PMID: 40777386 Free PMC article. Preprint.
-
Perinatal Exposure to Lead or Diethylhexyl Phthalate in Mice: Sex-Specific Effects on Cardiac DNA Methylation and Gene Expression across Time.Environ Health Perspect. 2025 Jun;133(6):67014. doi: 10.1289/EHP15503. Epub 2025 Jun 16. Environ Health Perspect. 2025. PMID: 40315424 Free PMC article.
-
Antiretrovirals for reducing the risk of mother-to-child transmission of HIV infection.Cochrane Database Syst Rev. 2007 Jan 24;(1):CD003510. doi: 10.1002/14651858.CD003510.pub2. Cochrane Database Syst Rev. 2007. Update in: Cochrane Database Syst Rev. 2011 Jul 06;(7):CD003510. doi: 10.1002/14651858.CD003510.pub3. PMID: 17253490 Updated.
-
Drugs for preventing postoperative nausea and vomiting in adults after general anaesthesia: a network meta-analysis.Cochrane Database Syst Rev. 2020 Oct 19;10(10):CD012859. doi: 10.1002/14651858.CD012859.pub2. Cochrane Database Syst Rev. 2020. PMID: 33075160 Free PMC article.
-
Interactions of Polychlorinated Biphenyls and Their Metabolites with the Brain and Liver Transcriptome of Female Mice.ACS Chem Neurosci. 2024 Nov 6;15(21):3991-4009. doi: 10.1021/acschemneuro.4c00367. Epub 2024 Oct 11. ACS Chem Neurosci. 2024. PMID: 39392776 Free PMC article.
References
-
- Adrian Alexa JR (2017) topGO, Bioconductor.
-
- Almazroo OA, Miah MK, and Venkataramanan R (2017) Drug metabolism in the liver. Clin Liver Dis 21:1–20. - PubMed
-
- Al-Salman F, and Plant N (2012) Non-coplanar polychlorinated biphenyls (PCBs) are direct agonists for the human pregnane-X receptor and constitutive androstane receptor, and activate target gene expression in a tissue-specific manner. Toxicol Appl Pharmacol 263:7–13, Elsevier BV. - PubMed
-
- Andrews TS, Atif J, Liu JC, Perciani CT, Ma X-Z, Thoeni C, Slyper M, Eraslan G, Segerstolpe A, Manuel J, Chung S, Winter E, Cirlan I, Khuu N, Fischer S, Rozenblatt-Rosen O, Regev A, McGilvray ID, Bader GD, and MacParland SA (2022) Single-cell, single-nucleus, and spatial RNA sequencing of the human liver identifies cholangiocyte and mesenchymal heterogeneity. Hepatol Commun 6:821–840, Ovid Technologies (Wolters Kluwer Health). - PMC - PubMed
Publication types
Grants and funding
LinkOut - more resources
Full Text Sources