[Preprint]. 2025 Jun 1:2025.04.27.650862.
doi: 10.1101/2025.04.27.650862.

Tumor-specific draining lymph node CD8 T cells orchestrate an anti-tumor response to neoadjuvant PD-1 immune checkpoint blockade

Affiliations

Tumor-specific draining lymph node CD8 T cells orchestrate an anti-tumor response to neoadjuvant PD-1 immune checkpoint blockade

Rachel Honigsberg et al. bioRxiv. .

Abstract

Elucidating the anti-tumor role of tumor-draining lymph nodes (tdLNs) in patients could offer critical mechanistic insight and shift therapeutic strategies from a tumor-centric approach to one that considers tumor-immune system interplay. Our study characterizes benign tdLNs T cell anti-tumor responses beyond initial T cell priming in patients with resectable non-small cell lung cancer. We further investigated whether tumor-specific tdLN T cells were altered by immune checkpoint blockade (ICB) locally and systemically. We performed single-cell TCR lineage tracing and transcriptomic profiling on 672,886 CD8 T cells from 41 tumor, benign tdLN, and blood samples in 14 patients treated with or without neoadjuvant chemoimmunotherapy (ChemoIO). Using deep-integrating clonal tracking with machine learning-based transcriptional analysis, our findings revealed that benign tdLNs locally and independently orchestrate two transcriptionally distinct tumor-specific memory CD8 T cell populations: one with ZNF683+ CXCR6+ tumor tissue-residency potential, and another with cytotoxic memory potential. Furthermore, tdLN-derived clones not only constitute the dominant tumor-infiltrating (75%) and circulating (>90%) tumor-specific expanded T cell populations but also preserve their transcriptionally distinct subset identities within the tumor T cell effector state. ChemoIO selectively increased the clonal diversity and cytotoxic memory/TEMRA programs of tdLN-derived clones locally and systemically, both of which remained unchanged in clones lacking tdLN TCR lineage. In conclusion, the tdLN locally orchestrates tumor-reactive and ChemoIO-reactive transcriptional distinct T cell subsets that shape the circulating blood and tumor T cell environments. These findings represent a clinical paradigm shift with implications regarding the extent of tdLN resection during surgery, timing of ChemoIO treatment, and the development of memory T cell-based immunotherapies.

Keywords: Lung cancer; T cells; immunotherapy; single-cell sequencing; tumor-draining lymph nodes.


Conflict of interest statement

Competing interests: All authors declare no potential conflicts.

Figures

Fig. 1:
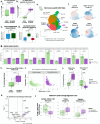
Fig. 1:. Defining and validating tumor-specific T cell clones in early-stage non-small cell lung cancer.
a. Schematic of patient sample collection sorting, sequencing and analysis pipeline. b. Selection of sequenced CD8 T cells (672,886 total) which have both scRNA and alpha and beta chains TCR sequenced (390,375 total) followed by dimensional UMAP dimensional reduction. c. Feature plots of NeoTCR tumor responsive signature, naïve-like signature and clone size., d. Schematic of tumor-specific clone-type pairings based on TCR tissue lineage tracing. e. UMAP labeling T cell tumor-specificity based TCR tissue lineage tracing described in d. f. Validation of tumor-specific clone type pairing categorization. Clonal average z-score of tumor T cell NeoTCR tumor responsive signature by TCR tissue lineage tracing, expansion and if the TCR was found as a viral epitope on the VDJ database. g. NeoTCR tumor responsive signature (Lowery et al.) clonal average z-score applied to each tissue by clonal tumor-specificity based on TCR lineage tracing described in d. (t-test, p < 0.0001). h. Naïve-like signature (Zheng et al.) clonal average z-score applied to each tissue by clonal tumor-specificity based on TCR lineage tracing described in d. (t-test, p < 0.0001). i. Percent of paired sc RNA/TCR clones that are tumor-specific per patient.
Fig. 2:
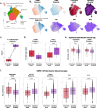
Fig. 2:. LN-paired T cells within the tumor are distinct from unpaired tumor T cells.
a. Patient tumor-specific clonal diversity (number of unique TCRs per 5,000 cells) of unpaired tumor only clones versus LN-paired clones (paired t-test, p < 0.0001). b. Average patient tumor-specific tumor T cell population proportion based on clonal lineage with the LN (clone type pairing described in 2.1 d.). c. UMAP dimensional reduction of tumor-specific CD8 T cells, including 77,359 T cells and 2,166 expanded clones, 14 patient tumor samples. Nine T cell cluster subsets were generated. d. Feature plot of signatures relating to T cell function normalized using z-score (mean = 0, STD = 1) and of gene expressions PRF1 and IL7R.,,, e. Relative clone type cluster proportion of unpaired tumor only clones and LN-paired clones (percent of clone type T cells within cluster for each patient/percent of clone type T cells for each patient). A value of 1 represents a cluster with clone type population proportions the same as the patient tumor clone type population proportions. f. Relative clone type cluster proportion of unpaired tumor only clones, direct LN-paired clones, and circulating LN-paired (percent of clone type T cells within cluster for each patient/percent of clone type T cells for each patient). A value of 1 represents a cluster with clone type population proportions the same as the patient tumor clone type population proportions. g-h. The clonal average z-score of (g.) stem cell-like and (h.) terminal exhaustion signatures within ZNF683+ TRM/Int Exhausted (cluster 1) and Terminal Ex. (cluster 0) clusters by clone type pairing., i. Heatmap of average z-score clonal expression levels per patient of genes representing a range of T cell functions (memory, inhibitor receptors, cytotoxic/effector, etc.) for each tumor-specific clonal type pairing category (unpaired tumor only clones, direct tumor-tdLN clones, circulating LN-paired clones, tumor-blood). The left of the heatmap are the density plots of cells per clone type pairing. j. Patient clonal average z-score of signatures from literature relating to T cell function by clone type within the tumor (t-test, ANOVA, all p < 0.0001, except ZNF683+ CXCR6+ TRM p < 0.01).,,,
Fig. 3:
Fig. 3:. Clonal differentiation of LN-paired clones begins in the tdLN and reflects the subtypes seen in the tumor.
a. Patient T cell clone type proportion within tdLN (paired t-test, p = 0.17). b. Clone type relative clonal expansion (average clone size) per patient (paired t-test, p < 0.0001). c-d. Average tissue proportion per clone per patient for direct LN-paired clones (c., paired t-test, p=0.93) and circulating LN-paired clones (d., paired t-test, ANOVA p < 0.0001). e. Dimensional reduction using UMAP of 51,249 tumor-specific CD8 tdLN T cells, including 1,689 expanded LN-paired tumor-specific clones from 14 patient samples. f. Feature plots of memory-like T cell signatures described by Zheng et al. g. Relative clone type cluster proportion of direct and circulating LN-paired T cells (percent of clone type T cells within cluster for each patient/percent of clone type T cells for each patient). A value of 1 represents a cluster with clone type population proportions the same as the patient tdLN clone type population proportions. h. Stem cell memory CD8 T cell average clonal signature z-score by clone type. i. Average clonal dysfunction versus average clonal cytotoxicity by Li et al. to distinguish cytotoxic and dysfunctional clones. j. Patient clonal average z-score of Li et al.’s cytotoxicity and dysfunction signatures. k. Differential expression between tdLN direct versus circulating LN-paired cells. l. Patient clonal average z-score signature expressions of T cells found within tdLN Naïve/CM cluster.
Fig. 4:
Fig. 4:. Contribution of LN-paired clones in circulating blood tumor-specific T cells.
a. Dimensional reduction using UMAP of 62,863 tumor-specific blood T cells including 1,156 clones and 13 patient samples. b. Feature plots of T cell signatures from the literature and gene expression signatures (IL7R, PRF1, and KLF2)., Top right are Dimplots highlighting tumor-blood paired and circulating LN-paired T cell UMAP locations overlaid by a density plot. c. Patient T cell clone type proportion within blood (paired t-test, p <0.001). d. Patient average clonal z-score of TEMRA (t-test, p=0.02) and T Naïve (t-test, p=0.048) signatures by Zheng et al. e. Patient clonal average z-score signature expressions of T cells found within the blood Cytotoxic E/EM cluster (t-test, p < 0.01)., f. Patient clonal average z-score signature expressions of T cells found within the blood GZMK+ CM-like cluster (t-test, p < 0.05).,
Fig. 5:
Fig. 5:. ChemoIO tumor-specific LN-paired response.
a. CT scan of patient pre- and post-3 dosages of PD-1 ICB + chemotherapy followed by surgical resection of tumor and LNs. To the right is the pathologic response distribution of the eight patients treated by ChemoIO. b. Patient tumor-specific clonal diversity (number of unique TCRs per 5,000 cells) between treatment Naïve and ChemoIO treated patients for unpaired tumor only clones (t-test, p = 0.45) and LN-paired clones (t-test, p = 0.045). c. Tumor-specific tumor T cell population proportion based on clonal lineage with the LN (clone type pairing described in 2.1 d.) per patient (paired t-test between unpaired tumor only clones and LN-paired clones) by treatment. d. Average clonal dysfunction versus average clonal cytotoxicity by Li et al. to distinguish cytotoxic and dysfunctional clones separated by treatment and clone type pairing. Gating Cytotoxic clones to have > 0.5 average cytotoxic signature and < −0.25 average dysfunctional signature and Dysfunctional clones < 0.5 average cytotoxic signature and > −0.25 average dysfunctional signature. e. Treatment differences of average clonal z-score of TEMRA expression within circulating LN-paired clones within the tdLN, tumor and blood (t-test, p < 0.0001). f. Treatment differences in circulating LN-paired clones found within tdLN NK-like cluster: clonal diversity per 200 cells (t-test, p=0.05), clonal average TEMRA signature expression (t-test, p < 0.0001), and clonal average cytotoxicity signature expression (t-test, p < 0.0001)., g. Feature plot on tumor-specific blood T cell UMAP of tdLN NK-like cluster signature (z-score normalized). h-j. Comparison of treatment response of blood T cells with tdLN NK-like positive (NK-like cluster signature high, z>0) within tumor-blood clones and circulating and LN-paired clones. h. Proportion of T cells per patient with tdLN NK-like positive (t-test, tumor/blood clones p=0.25, circulating LN-paired p=0.034)., i-j. NK-like positive blood T cell average clonal z-score of TEMRA and cytotoxicity signature. k-n. Treatment differences between tumor-blood (t-test, p=0.46) and circulating LN-paired (t-test, p=0.0051) patient clonal average of cytolytic CCR7- CD27- CX3CR1+ signature by Buggert et al. l. Differential expression between ChemoIO versus Naïve tumor-specific blood T cells. m. Feature plot of tdLN UMAP of blood ChemoIO high signature (differentially expressed genes from l. with average log fold change > 0.5 and p adjusted value < 0.05). Linear regression of tumor-specific blood T cell clonal averages of blood ChemoIO high signature versus CCR7- CD27- CX3CR1+ signature by Buggert et al. (R=0.83, p<0.001), blood ChemoIO high signature versus TEMRA signature by Zheng et al. (R=0.87, p<0.0001), and blood ChemoIO high signature versus tdLN NK-like cluster signature (R=0.67, p<0.0001).,

References

    1. Gao S., Wu Z., Arnold B., Diamond C., Batchu S., Giudice V., Alemu L., Raffo D. Q., Feng X., Kajigaya S., Barrett J., Ito S., & Young N. S. (2022). Single-cell RNA sequencing coupled to TCR profiling of large granular lymphocyte leukemia T cells. Nature Communications, 13(1), 1982. 10.1038/s41467-022-29175-x - DOI - PMC - PubMed
    1. Pai J. A., Hellmann M. D., Sauter J. L., Mattar M., Rizvi H., Woo H. J., Shah N., Nguyen E. M., Uddin F. Z., Quintanal-Villalonga A., Chan J. M., Manoj P., Allaj V., Baine M. K., Bhanot U. K., Jain M., Linkov I., Meng F., Brown D., … Satpathy A. T. (2023). Lineage tracing reveals clonal progenitors and long-term persistence of tumor-specific T cells during immune checkpoint blockade. Cancer Cell, 41(4), 776–790.e7. 10.1016/j.ccell.2023.03.009 - DOI - PMC - PubMed
    1. Manfredini Beatrice, et al. “The Role of Lymphadenectomy in Early-Stage NSCLC.” Cancers, vol. 15, no. 14, 14, Jan. 2023, p. 3735. www.mdpi.com, 10.3390/cancers15143735. - DOI - PMC - PubMed
    1. Watanabe Shun-ichi, and Asamura Hisao. “Lymph Node Dissection for Lung Cancer: Significance, Strategy, and Technique.” Journal of Thoracic Oncology, vol. 4, no. 5, May 2009, pp. 652–57. www.jto.org, 10.1097/JTO.0b013e31819cce50. - DOI - PubMed
    1. du Bois Haley, et al. “Tumor-Draining Lymph Nodes: At the Crossroads of Metastasis and Immunity.” Science Immunology, vol. 6, no. 63, Sept. 2021, p. eabg3551. science.org (Atypon), 10.1126/sciimmunol.abg3551. - DOI - PMC - PubMed

Publication types