[Preprint]. 2025 Jun 5:2025.06.02.657480.
doi: 10.1101/2025.06.02.657480.

Cell-surface proteomic profiling identifies CD72 as a regulator of microglial tiling

Affiliations

Cell-surface proteomic profiling identifies CD72 as a regulator of microglial tiling

Tamara C Chan et al. bioRxiv. .

Abstract

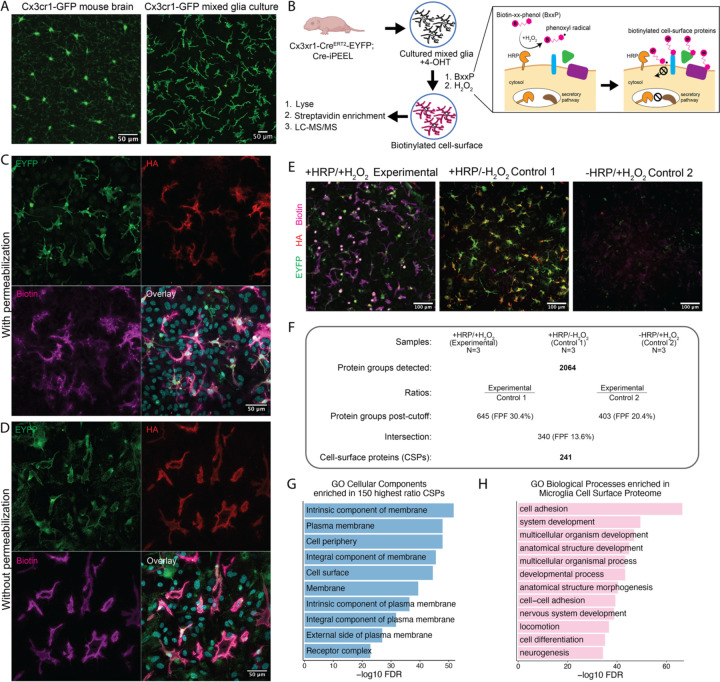
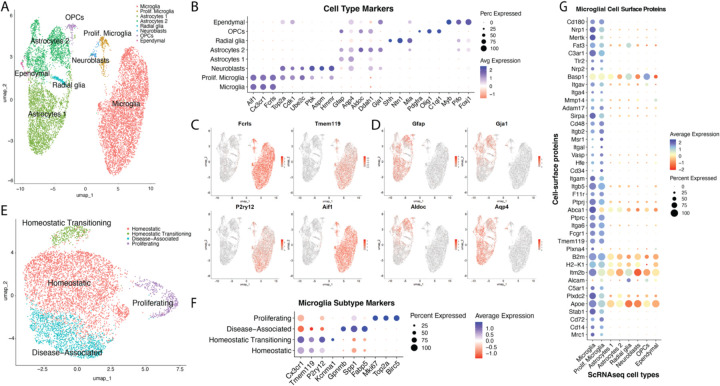
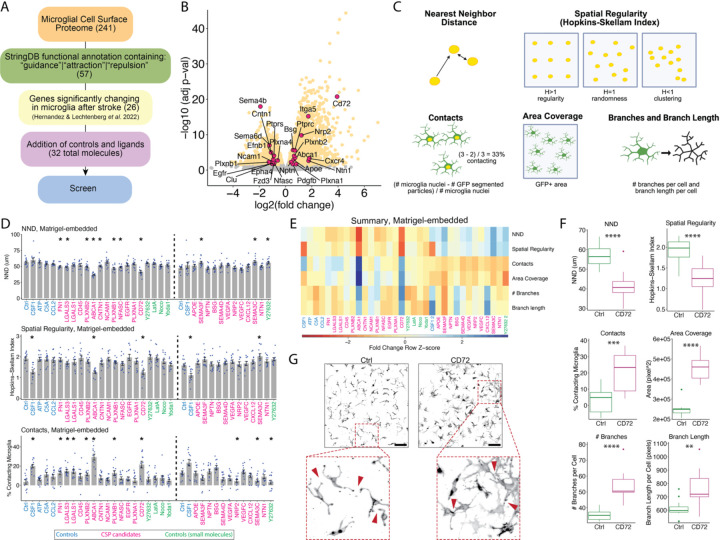
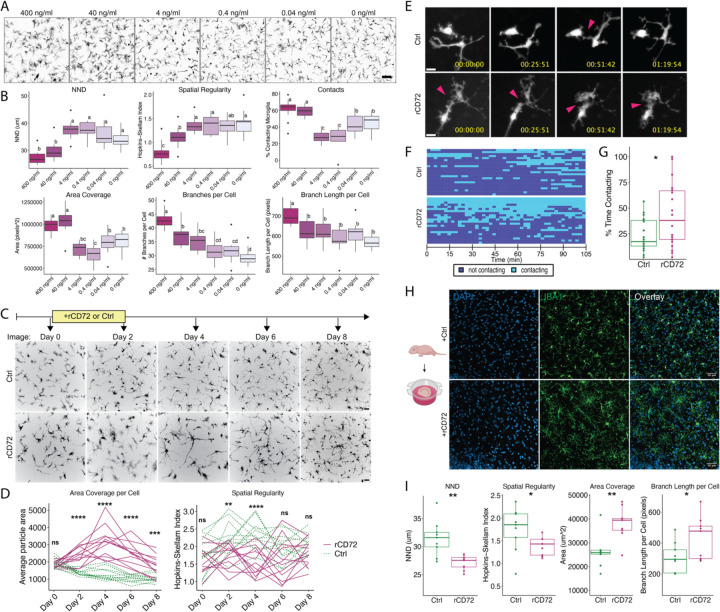
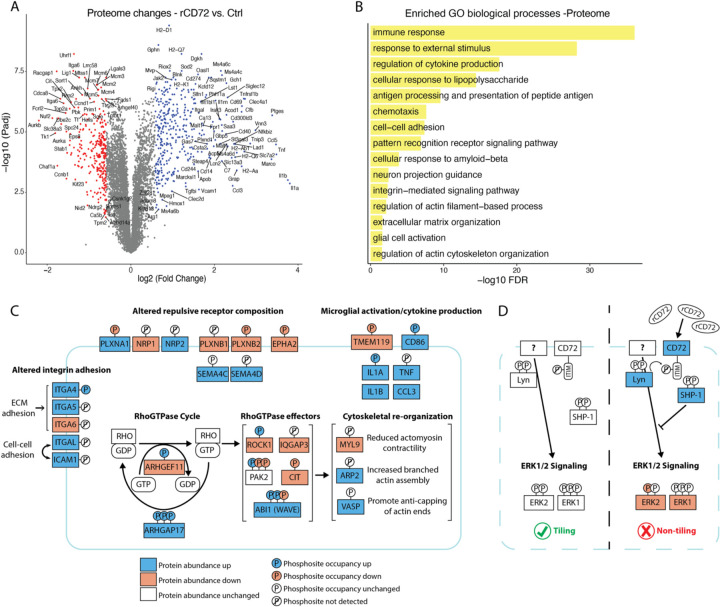
Microglial tiling-the phenomenon of consistent cell-to-cell distances and non-overlapping processes-is regarded as a qualitative indicator of homeostasis, but mechanisms of microglial tiling are unknown. We used cell-surface proximity labeling and mass spectrometry to profile the microglial cell-surface proteome in an in vitro model of homeostatic glial physiology and used single-cell RNA sequencing and public databases to identify candidate cell-surface proteins that might modulate tiling. We designed an image-based functional assay which measures six morphological/spatial readouts to screen these proteins for modulation of tiling. CD72, a coreceptor to the B cell receptor that is expressed by microglia, disrupted tiling; we validated its effects in vitro and in situ in organotypic hippocampal brain slices. Phosphoproteomic studies revealed that CD72 modulates pathways associated with cell adhesion, repulsive receptors, microglial activation, and cytoskeletal organization. These results lay the groundwork for further investigation of the functional roles of tiling in homeostasis and disease.


Conflict of interest statement

DECLARATION OF INTERESTS The authors declare no competing interests.

Figures

Figure 1.
Figure 1.. Microglial cell-surface proteome revealed by proximity labeling and mass spectrometry
(A) Immunofluorescent images of microglial tiling in mouse brain section (left) and mixed glia culture (right), from Cx3cr1-GFP mice, stained for GFP. (B) Workflow for proximity labeling of mixed glia culture, including schematic of HRP-mediated catalysis of cell-surface biotinylation. (C and D) Immunofluorescent images showing co-localization of microglia (stained for EYFP, green), HRP expression (stained for HA-tag, red), and biotinylated protein (stained with Streptavidin-647, magenta); stained with 0.2% Triton-X in all buffers (C) or without Triton-X (D). (E) Immunofluorescent images overlaying all three channels (EYFP in green, HA in red, biotinylated protein in magenta), showing conditions: Cx3cr1-CreERT2-EYFP+ glia treated with all labeling reagents (Experimental), Cx3cr1-CreERT2-EYFP+ glia treated with labeling reagents except H2O2 (Control 1), Cx3cr1-CreERT2-EYFP- glia treated with all labeling reagents (Control 2). (F) Summary of ratiometric and cutoff analysis of microglial cell-surface proteome. N=3 15cm dishes for each condition were used as starting material for streptavidin enrichment and label-free LC-MS/MS. See also Figure S1B and C, Table S1, and STAR Methods. (G) Enriched GO Cellular Components from the top 150 proteins with highest ratios within the ranked Experimental/Control 2 list. Enrichment results were similar for the Experimental/Control 1 list (data not shown). See Table S1. (H) Enriched GO Biological Processes from final 241 CSPs.
Figure 2.
Figure 2.. scRNAseq characterizes mixed glia culture and reveals cell type-specific origins of the microglial cell-surface proteome
(A) UMAP plot of all cells collected from the mixed glia culture, with clusters annotated as cell types. (B) Dot plot of DEG markers (each cluster over all other cells) used to assign cell types in (A). See also Table S2. (C) UMAP clusters overlaid with expression patterns for microglial genes. (D) UMAP clusters overlaid with expression patterns for astrocytic genes. (E) UMAP plot showing subsetted microglia cluster from (A), subclustered to reveal four microglial subtypes. (F) Dot plot of DEG markers (each subcluster over all other microglia) used to assign microglial subtype in (E). See also Table S3. (G) Dot plot of a subset of CSPs identified in Figure 1 (y-axis) whose corresponding transcripts are primarily produced by microglia based on scRNAseq expression (clusters along x-axis). See also Figure 1 and S2A, and Table S4.
Figure 3.
Figure 3.. An image-based screen identifies CD72 as a strong regulator of tiling
(A) Tiling candidate list development. 241 CSPs were filtered by 1) StringDB functional annotations matching key words, 2) published bulk RNA sequencing dataset of significantly up- or downregulated (p-adjusted <0.05) microglial transcripts three days after distal middle cerebral artery occlusion stroke in mice. Known ligands to CSPs and controls for morphometric readouts were added. See Table S5. (B) Volcano plot of microglial transcripts three days after distal middle cerebral artery occlusion stroke in mice, with 26 significantly changing genes of corresponding CSPs (p-adjusted <0.05) highlighted in magenta dots. (C) Visual explanation of the six features quantified as the screen readout. Samples were stained for GFP (from Cx3cr1-GFP) to label microglia and DAPI. Cartoon yellow nuclei indicate that the overlap between GFP and DAPI signal was used for that quantification. See STAR Methods. (D) Data from NND, spatial regularity, and contacts of the Matrigel-embedded screen. N= Four images from each of three wells, 12 technical replicates. Bars show mean ± SEM. Two rounds of screening were performed, with rounds separated by vertical dotted lines. Molecules are shown in the order they were tested. X-axis text color represents category of molecule. Adjusted p-values (Benjamini-Hochberg (BH) method): *p<0.05 by Welch’s t-test between respective molecule and Ctrl (vehicle 0.1% BSA) within round. See also Figure S3A and B. (E) Summary heatmap of all features for every candidate in both rounds of the Matrigel-embedded screen. Color bar represents fold-change over respective Ctrl within round. X-axis text color represents the same as in (D). (F) Boxplots of six features showing differences between Ctrl and CD72 samples (data extracted from Matrigel-embedded screen). P values: *p<0.05, **<p<0.01, ***p<0.001, ****p<0.0001 by Welch’s t-test. (G) Representative images (GFP channel) for Ctrl and CD72 (Matrigel-embedded screen). Red arrowheads indicate locations of upheld tiling in Ctrl and disrupted tiling in CD72 condition. Scale bar = 100μm.
Figure 4.
Figure 4.. Recombinant CD72-mediated disruption of tiling is dose-dependent, reversible, and consistent in situ
(A) Representative images of GFP channel (from Cx3cr1-GFP mixed glia) treated with varying doses of rCD72. Scale bar = 100μm. (B) Boxplot quantifications of all features at every dose tested. N=four images in each of three wells, 12 technical replicates. One-way ANOVA, post-hoc Tukey’s test, and compact letter display was applied. (C) Experimental timeline and representative images from longitudinal live imaging of endogenous GFP signal before incubation (Day 0), after two days of incubation with (Day 2), and after removing (Days 4, 6, and 8) 400ng/ml soluble rCD72 or Ctrl (vehicle 0.1% BSA). Scale bar = 50μm. (D) Quantifications of area coverage per cell and spatial regularity at every timepoint. N=four fields of view in each of three wells, 12 technical replicates. The same fields of view were imaged across days and are connected by lines. P-values: ns = not significant, *p<0.05, **p<0.01, ***p<0.001, ****p<0.0001 by Welch’s t-test between means of Ctrl and CD72 at that timepoint. (E) Confocal timelapse imaging of Ctrl- and rCD72-treated (400ng/ml) Cx3cr1-GFP mixed glia over 1.75 hours (time is displayed as HH:MM:SS format). Representative images are zoomed-in fields of view imaged across time (left to right). Magenta arrowheads indicate where a contact was detected. Scale bar = 25μm. (F) Binary heatmap showing Ctrl, N=23, and rCD72, N=22, fields of view (each row = one field of view) across two videos per condition. Time is represented from left to right. Instances of contact, light blue; non-contact, dark blue. (G) Boxplot showing percent time contacting. P-value: *p<0.05 by Wilcoxon Rank Sum Test. (H) In situ treatment of wildtype organotypic hippocampal slices with Ctrl or rCD72, with representative confocal images stained for DAPI in blue and Iba1 in green. Scale bar = 50μm. (I) Boxplot quantifications of tiling features from images in (H), quantified from the Iba1 channel. Data represent N=9 images across three biological replicates. P-values: *p<0.05, **p<0.01 by Welch’s t-test.
Figure 5.
Figure 5.. rCD72 induces molecular pathways consistent with tiling disruption and microglial immune response
(A) Volcano plot showing protein abundance changes in microglia enriched from the mixed glia culture treated with Ctrl (vehicle 0.1% BSA) or 400ng/ml rCD72, N=6 each. Welch’s t-test was applied between Ctrl and rCD72, then p-values adjusted using BH method. Average fold-changes were calculated. Red dots denote downregulation and blue dots denote upregulation with rCD72 treatment (fold-change cutoff:1.5, adjusted p-value cutoff: 0.05). See also Table S6. (B) Enriched biological processes from significantly changing proteins. (C) Schematic depicting specific proteins related to enriched GO terms in (B) and their phosphorylation sites. The criterion for coloring was adjusted p-value <0.05 (no fold-change cutoff). The number of phosphorylation sites depicted on each protein is not necessarily the number of phosphorylation sites detected; however, any significant changes are shown. See Table S6. (D) Schematic depicting proteins within known CD72 signaling pathways and hypotheses about their roles in microglial tiling. Left of the black dotted line represents proteins at steady-state: CD72 is a coreceptor to an unknown microglial receptor that is analogous to the BCR in B cells. Right of the black dotted line: upon rCD72 treatment, LYN (kinase associated with the unknown receptor) phosphorylates the ITIM motif on CD72, recruiting SHP-1 (phosphatase) to downmodulate signaling by the unknown receptor, which could result in reduced ERK1/2 signaling, resulting in non-tiling. Coloring of proteins and phosphorylation sites on the right of the dotted line follows the same criterion as in (C).
Figure 6.
Figure 6.. CD72 overexpression in microglia recapitulates aspects of rCD72-mediated tiling disruption.
(A) Workflow describing AAV-mediated overexpression of CD72 (or 3xFlag as control) in mixed glia, puromycin (puro) selection, microglia enrichment via magnetic activated cell sorting (MACS), then replating with uninfected non-microglia. Tiling analysis was performed 48 hours later. (B) Western blotting analysis on lysate from puro-selected and enriched CD72- or 3xFlag-overexpressing microglia stained for CD72 and β-actin as loading control. (C) Quantification of four technical replicates from western blot in (B). CD72 bands are normalized to β-actin band densities. Bars show mean ± SEM. *p<0.05 by Welch’s T-test. (D) Quantifications of tiling features. N=four images in each of five wells, 20 technical replicates. All p-values by Welch’s T-test are listed. (E) Representative images of microglia over-expressing 3xFlag or CD72.

Similar articles

References

    1. Hickman S., Izzy S., Sen P., Morsett L., and El Khoury J. (2018). Microglia in neurodegeneration. Nature Neuroscience 21, 1359–1369. 10.1038/s41593-018-0242-x. - DOI - PMC - PubMed
    1. Keren-Shaul H., Spinrad A., Weiner A., Matcovitch-Natan O., Dvir-Szternfeld R., Ulland T.K., David E., Baruch K., Lara-Astaiso D., Toth B., et al. (2017). A Unique Microglia Type Associated with Restricting Development of Alzheimer’s Disease. Cell 169, 1276–1290.e1217. 10.1016/j.cell.2017.05.018. - DOI - PubMed
    1. Hammond T.R., Dufort C., Dissing-Olesen L., Giera S., Young A., Wysoker A., Walker A.J., Gergits F., Segel M., Nemesh J., et al. (2019). Single-Cell RNA Sequencing of Microglia throughout the Mouse Lifespan and in the Injured Brain Reveals Complex Cell-State Changes. Immunity 50, 253–271.e256. 10.1016/j.immuni.2018.11.004. - DOI - PMC - PubMed
    1. Safaiyan S., Besson-Girard S., Kaya T., Cantuti-Castelvetri L., Liu L., Ji H., Schifferer M., Gouna G., Usifo F., Kannaiyan N., et al. (2021). White matter aging drives microglial diversity. Neuron 109, 1100–1117.e1110. 10.1016/j.neuron.2021.01.027. - DOI - PubMed
    1. Savage J.C., Carrier M., and Tremblay M.-È. (2019). Morphology of Microglia Across Contexts of Health and Disease. In (Springer New York), pp. 13–26. 10.1007/978-1-4939-9658-2_2. - DOI - PubMed

Publication types

LinkOut - more resources