[Preprint]. 2025 Jun 1:2025.06.01.657215.
doi: 10.1101/2025.06.01.657215.

Dynamic flexibility of the murine gut microbiota to morphine disturbance enables escape from the stable dysbiosis associated with addiction-like behavior

Affiliations

Dynamic flexibility of the murine gut microbiota to morphine disturbance enables escape from the stable dysbiosis associated with addiction-like behavior

Izabella Sall et al. bioRxiv. .

Abstract

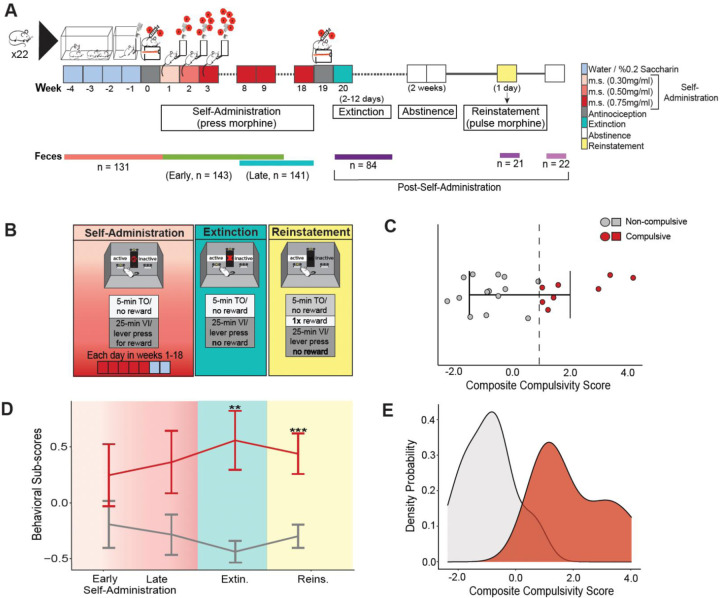
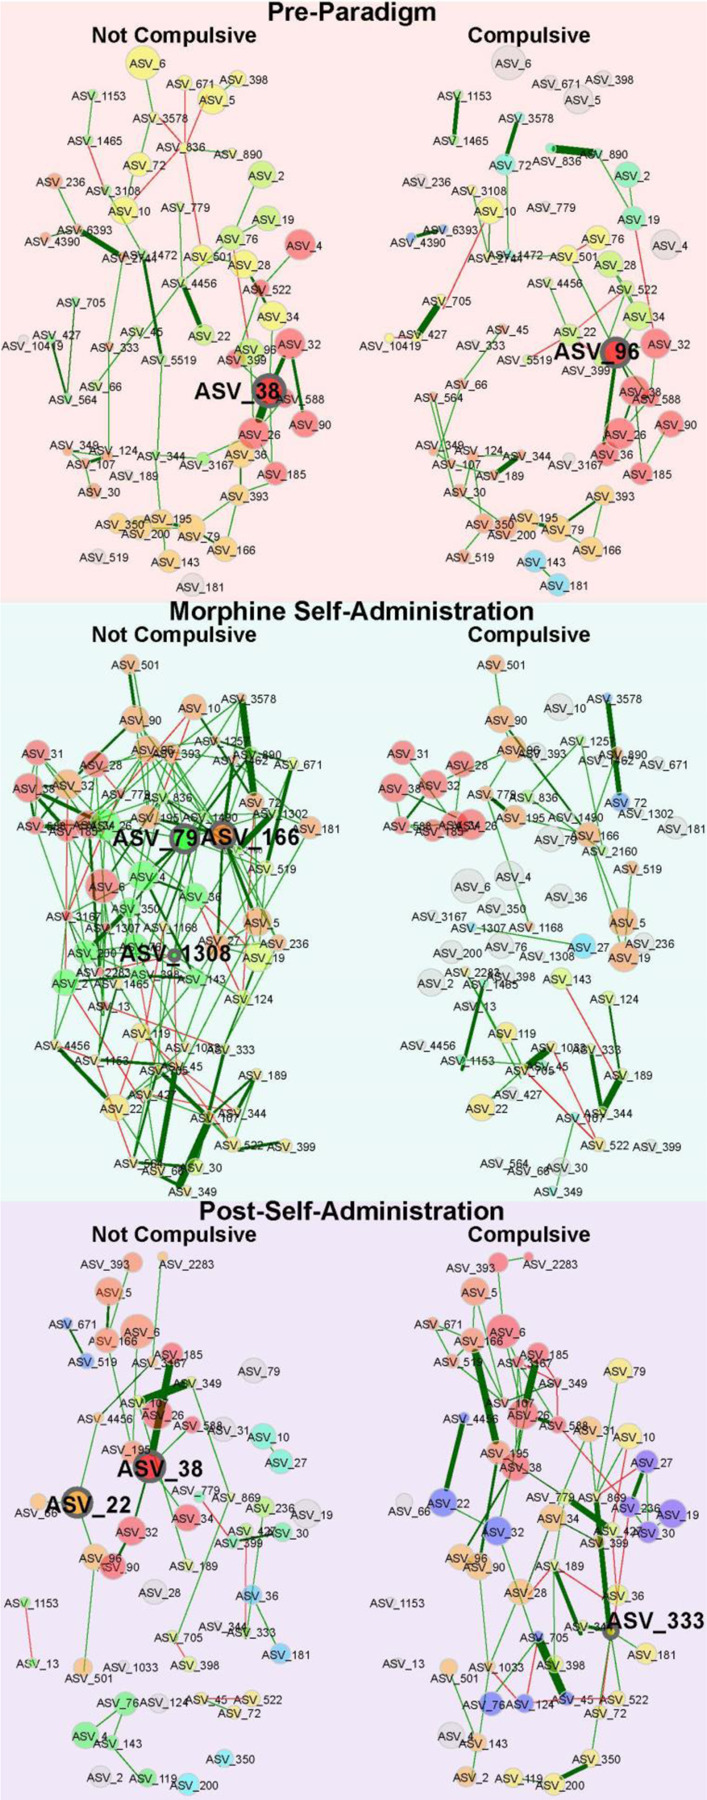
Although opioids are effective analgesics, they can lead to problematic drug use behaviors that underlie opioid use disorder (OUD). Opioids also drive gut microbiota dysbiosis which is linked to altered opioid responses tied to OUD. To interrogate the role of the gut microbiota in a mouse model of OUD, we used a longitudinal paradigm of voluntary oral morphine self-administration to capture multiple facets of drug seeking and preserve both individual behavioral response and gut microbiota variation to examine associations between these two variables. After prolonged morphine consumption, only a subset of mice transitioned to a state we define statistically as compulsive. In compulsive mice, morphine fragmented the microbiota networks which subsequently reorganized to form robust novel connections. In contrast, the communities of non-compulsive mice also changed but were highly interconnected during morphine disturbance and maintained more continuity post morphine suggesting dynamic flexibility. Compulsive mice displayed a greater loss of functional diversity and a shift towards a new stable state dominated by potential pathobionts, whereas non-compulsive mice better preserved genera associated with gut health and broader functional diversity. These findings highlight how persistent and stable gut microbiota dysbiosis aligns with long-term behavioral changes underlying OUD, potentially contributing to relapse.

Keywords: Microbiota; compulsive behaviors; dysbiosis; morphine; network analysis; opioid; opioid use disorder.


Conflict of interest statement

DISCLOSURE STATEMENT The authors have no competing interests to declare.

Figures

Figure 1:
Figure 1:. Wild-type mice diverge over time in their display of drug-seeking behaviors allowing assignment to compulsive or non-compulsive populations.
A) Three phase animal behavioral paradigm for development of compulsive behaviors including a self-administration phase with increasing doses of morphine (0.3 mg/mL week one, 0.5 mg/mL week two, and 0.75 mg/mL weeks three to 18), an extinction phase where reward was withheld followed by a two-week abstinence period where only water was available in the home cage, and a reinstatement phase where reward was not contingent on lever-pressing. Voluntary morphine consumption, preference for morphine over saccharin, development of antinociceptive tolerance, and differences in drug-seeking behaviors were monitored. Feces were collected from mice (n = 22) throughout the study, color coded by phase, and used to generate 16S (V4-V5 region, see methods) sequencing reads for microbiota analyses. B) Weekly operant sessions (red gradient box) were used to document motivation to obtain drug by lever pressing to obtain reward. After the 18-week morphine self-administration phase, the rate and extent of extinction (teal box) and reinstatement (yellow box) were measured (see methods for more details). C) Mice were statistically categorized as compulsive if their composite compulsivity score is >1 interquartile deviation (IQD) above the population mean as indicated by the grey dashed line (red) or non-compulsive if below this threshold (grey). D) The trajectory of divergence of the two populations of mice were visualized using individual mouse behavioral sub-scores, which included an early self-administration sub-score using measures only from the first three weeks and a late self-administration score based on behaviors from weeks 16–18, the latter of which was used as the final sub-score for self-administration (see). Statistical differences in sub-scores of compulsive (red line) and non-compulsive (grey line) mice were assessed using the Student’s t-test. Significance thresholds are indicated as ** = p < 0.01 and *** p < 0.001. E) Population distribution of individual mice categorized as compulsive (red) or non-compulsive (grey) visualized using a density probability plot, which estimates the probability distribution of composite scores as a continuous curve to identify modal patterns and overall spread in the data from observed data points.
Figure 2:
Figure 2:. Gut microbiota of all mice shifted to an alternative stable state in response to prolonged morphine exposure.
A) Temporal changes in the gut microbiota β-diversity (all ASVs, Jensen-Shannon dissimilarity) prior to (pre-paradigm, orange), and after (post-self-administration, pink), the 18-week morphine self-administration phase as visualized by principal coordinates analysis (PCoA). See Supplemental Table 2 for details. The black dashed line corresponds to the separation between the two normal distributions demonstrated in panel B. B) Determination of the number of clusters using Bayesian Information Criterion (BIC) in Gaussian mixture modeling (GMM) via the R package mclust (v6.1.1) as visualized by frequency distributions of PCoA axis one coordinates extracted from (A) as a measure of microbiota state(s). The number of clusters was statistically validated by bootstrap sequential Likelihood Ratio Testing (LRT) (*** = p < 0.001). C) Mean β-dispersion (microbiota variability) (All ASVs, Jensen-Shannon dissimilarity) of post-self-administration (pink) relative to pre-paradigm (orange). Differences in microbiota variability were evaluated using pairwise permutation tests, with significant levels denoted as follows: ** = p < 0.01. D) Comparison of standard deviations (SD) of all individual ASVs between samples taken during pre-paradigm (orange) and post-self-administration (pink). Differences in the SD distributions of all individual ASVs during pre-paradigm (orange) and post-self-administration (pink) were evaluated using the F-test under the assumption of normality, with significant levels denoted as follows: *** = p < 0.001.
Figure 3:
Figure 3:. The morphine-adapted microbiota of compulsive mice was relatively more stable than the microbiota of non-compulsive mice.
A) Temporal change of average ASV richness of individual compulsive (red) and non-compulsive (grey) mice through the three-phase behavioral paradigm. The first three timepoints (Sample 1, Sample 2, Sample 3) represent normal day-to-day variability of the gut microbiota in the absence of disturbance as determined from samples collected pre-saccharin (during weeks −4 to −3, Figure 1A). Samples collected during saccharin and the paradigm are aggregated and averaged by mouse where multiple samples were available (i.e., pre-paradigm, self-administration, extinction). See Figure 1A for paradigm details. B) When normality assumptions were met, differences in between-animal ASV richness variability were assessed using Bartlett’s test, whereas differences in within-animal ASV richness variability were assessed using the F-test. Comparisons were made for compulsive and non-compulsive mice within a phase, or across phases within compulsive mice or non-compulsive mice. C) Simplified visual of microbiota samples used to calculate the RL index during the press and pulse morphine disturbances based on the paradigm schematic in Figure 1A. The RL index was calculated as the change in ASV richness of the disturbed and recovered microbiota, each relative to the ASV richness of the reference microbiota. Normal day-to-day variability was visualized by calculating an RL index score using ASV richness (pink bar) to establish a threshold for normal variation (black dashed lines). RL scores for the recovery of ASV richness, in compulsive and non-compulsive mice following press or pulse morphine disturbances was calculated by averaging ASV richness across all mice for the reference state, while ASV richness was averaged across samples within individual mice for the disturbance and recovery states. Differences in mean RL scores between compulsive (red bar) and non-compulsive (grey bar) mice were evaluated using the Welch Two-Sample T-test or Wilcoxon Rank Sum test, with significant levels denoted as follows: * = p < 0.05.
Figure 4:
Figure 4:. The microbiota networks of non-compulsive mice displayed greater connectivity and continuity during and after morphine whereas the networks of compulsive mice were fragmented and profoundly altered by morphine.
Comparison of microbiota co-occurrence networks between compulsive and non-compulsive mice pre-paradigm (left panel), during morphine self-administration (middle panel), and after prolonged morphine during extinction, reinstatement, and post-paradigm (post-self-administration) (right panel) using the SPRING method in NetCoMi. Edges are colored by sign (positive = green; negative = red), representing estimated associations between community members which are represented by colored circles with ASV listed and that are differentially colored by modules. Hubs are identified with bolded text of the ASV. Eigenvector centrality was used for scaling sizes of the circles representing genera (determined using greedy modularity optimization) where a shared color circle means the ASVs are highly connected to one another but have a small number of connections outside their group and assigned to the same module. Modules have the same color in both networks during pre-paradigm, during self-administration, and post-self-administration if they share at least two genera. Only genera that are connected in either compulsive and non-compulsive groups are included in the network, where grey circles indicate the ASV is not connected in one of the two parallel networks. Corresponding genera names detailed in Supplemental Table 3.
Figure 5:
Figure 5:. Microbiota associations with extreme compulsivity scoring mice.
Biomarkers of the most compulsive (n = 3 mice, red circles) and least compulsive (n= 4 mice, grey circles) --see inset-- were identified from among the community members whose abundance was explained by categorical assignment (as identified using corncob regression models), followed by a linear discrimination analysis (LDA) of effect size (LEfSe), representing genera that most likely explain differences between the microbiota in each category. Mice with scores above the population average + 2 IQD (red circles, inset distribution) or with scores below the population average - 2 IQD (grey circles, inset distribution) were used in this analysis, whereas mice with moderate scores (white circles, inset distribution) were not used for biomarker identification. Community members are labeled at the genus level or at the lowest classification available when genus assignment was not available. * by the genera name were identified as biomarkers when microbiota from all phases of the paradigm were combined. See Supplemental Table 4 for details.
Figure 6:
Figure 6:. Gut microbiota genera were more strongly correlated with higher compulsivity scores than lower compulsivity scores.
A) Associations of center-log ratio (CLR) transformed relative abundances of individual genera (labeled as ASV) with composite compulsivity score using microbiota from a given stage or phase where circles representing effect size of genera are colored by stage or phase of the paradigm including pre-paradigm (orange circles), early self-administration (green circles), late self-administration (blue circles), and extinction (purple circles) were assessed using multivariable association testing with linear models (MaAsLin 2). Negative correlation coefficient values indicate inverse correlations with composite compulsivity scores, and positive correlation coefficient values represent direct correlations with composite compulsivity scores distributed horizontally. The size of individual colored circles correspond to the magnitude of effect size, or the strength of the correlation. B) Associations of CLR transformed relative abundances of individual genera (labeled as ASVs) from all phases combined (light grey circles) with composite compulsivity scores were assessed using multivariable association testing with linear models (MaAsLin 2). Only genera identified as significantly correlated based on the default threshold (q-value of 0.25, noted as the inverse log q = 0.6) as indicated by the dashed black line, are presented. Negative correlation coefficient values indicate inverse correlations with composite compulsivity scores, and positive correlation coefficient values represent direct correlations with composite compulsivity scores distributed horizontally. The size of individual grey circles corresponds to the magnitude of effect size, or the strength of the correlation. C) Genera names for ASV labels from A and B are organized in descending order of magnitude of effect size. See Supplemental Figure 8 for correlations, including those below the significance threshold.
Figure 7:
Figure 7:. Predictive genera formed dynamic associations in non-compulsive mice, contrasted with more stable and persistent associations in compulsive mice.
A) The total number of unique genera identified per phase during weighted classification modeling (using categorical assignments) using permutation testing in mikropml (top), and identification of genera that are most important for the generation of random forest prediction models to classify mice as either compulsive (red) or non-compulsive (grey) at specific phases of the paradigm using mikropml and that were also identified by previous analyses (bottom panel) using compulsivity as a categorical variable (i.e., biomarkers and network hubs) to determine whether a predictive community member most likely originates from a microbiota of a compulsive (red) or non-compulsive (grey) mouse. See Supplemental Figure 10 for the complete list of genera important for model performance. B) The number of unique genera identified per phase during regression modeling (using composite compulsivity scores) using permutation testing in mikropml (top) and identification of genera that are most important for the generation of random forest prediction models to associate with the degree of compulsivity at specific phases of the paradigm using mikropml that were identified by other analyses using compulsivity as a continuous variable (i.e., multivariate association with linear models) to associate whether a predictive genus most likely originates from the microbiota of a mouse with a lower or higher compulsivity score (bottom panel). See Supplemental Figure 11 for the complete list of genera important for model performance.

Similar articles

References

    1. Nadeau SE, Wu JK, Lawhern RA. Opioids and Chronic Pain: An Analytic Review of the Clinical Evidence. Front Pain Res (Lausanne). 2021;2:721357. Epub 20210817. doi: 10.3389/fpain.2021.721357. - DOI - PMC - PubMed
    1. Han B, Compton WM, Blanco C, Crane E, Lee J, Jones CM. Prescription Opioid Use, Misuse, and Use Disorders in U.S. Adults: 2015 National Survey on Drug Use and Health. Ann Intern Med. 2017;167(5):293–301. Epub 20170801. doi: 10.7326/M17-0865. - DOI - PubMed
    1. Volkow N, Benveniste H, McLellan AT. Use and Misuse of Opioids in Chronic Pain. Annu Rev Med. 2018;69:451–65. Epub 20171013. doi: 10.1146/annurev-med-011817-044739. - DOI - PubMed
    1. Diagnostic and statistical manual of mental disorders: DSM-5, 5th ed, (2013). - PubMed
    1. Gooding SW, Whistler JL. A Balancing Act: Learning from the Past to Build a Future-Focused Opioid Strategy. Annu Rev Physiol. 2024;86:1–25. Epub 20231129. doi: 10.1146/annurev-physiol-042022-015914. - DOI - PMC - PubMed

Publication types

LinkOut - more resources