[Preprint]. 2025 Jun 6:2025.06.05.658111.
doi: 10.1101/2025.06.05.658111.

Wolbachia induces host cell identity changes and determines symbiotic fate in Drosophila

Affiliations

Wolbachia induces host cell identity changes and determines symbiotic fate in Drosophila

Jodie Jacobs et al. bioRxiv. .

Abstract

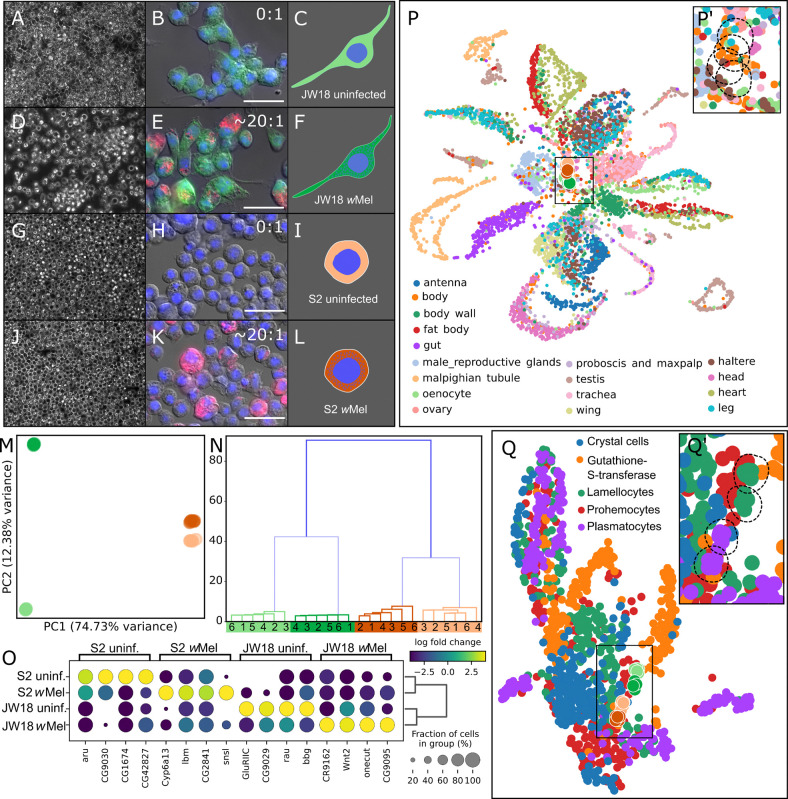
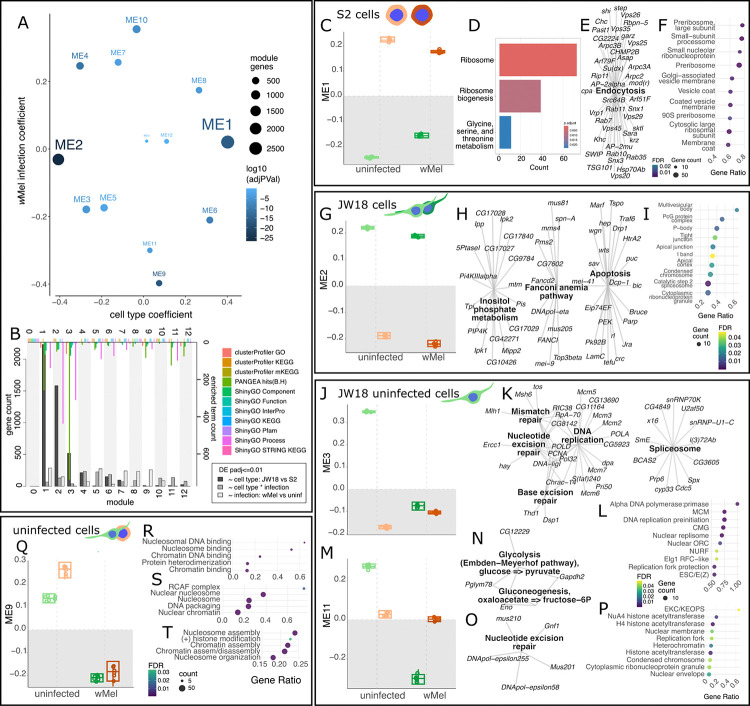
Many host-associated bacteria influence the differentiation of their eukaryotic host cells. The association between Wolbachia pipientis and Drosophila melanogaster offers a model for understanding how host-microbe gene expression co-evolves. Using Wolbachia-infected Drosophila cell lines, we show that the wMel strain alters host cell states, inducing novel gene expression programs that diverge from known cell types. Transcriptomic co-expression network analysis identified gene expression modules specific to each cell type and infection state, and revealed that wMel tailors its gene expression to host context. In macrophage-like host cells, wMel expresses pathogenic effectors, whereas in neuron-like cells, wMel upregulates metabolic genes. Micro-C chromatin contact data revealed that many of these infection-induced changes are epigenetically encoded, with wMel infection conferring reduced chromatin contacts and widespread transcriptional derepression in D. melanogaster. These findings show that the nature of Wolbachia symbiosis-mutualistic or pathogenic-emerges from host cell environments and suggest new paths for engineering host-specific microbial phenotypes.


Conflict of interest statement

Declaration of Interests: Richard E Green holds patents for the methods behind the Micro-C chromatin conformation capture kit and he holds a financial stake in the company who sells these kits, Dovetail Genomics. No other authors have any financial interests or patents to declare. None of the authors were board or advisory committee members or paid consultants related to this study or journal.

Figures

Figure 1.
Figure 1.
Wolbachia infection alters Drosophila cell line morphologies and transcriptomic cell states. A-L) Immortalized D. melanogaster A-F) JW18 and G-L) S2 cell lines. A,B,G,H) uninfected and D,E,J,K) infected with wMel Wolbachia. A,D,G,J) Live cultures imaged at 40x on a tissue culture microscope. B,E,H,K) Fixed and stained cells imaged on an epifluorescent compound microscope. Green=Jupiter-GFP, Blue=DAPI, Red=16S rRNA. Scale bars = 25 µm. C,F,I,L) Schematic representations of the cell lines and their morphologies, colored by cell type and infection state. M) Principal Component Analysis (PCA) revealing distinct transcriptomic profiles by cell line and infection status (orange=JW18, green=S2). N) Hierarchical clustering dendrogram by dissimilarity, demonstrating primary separation by cell line, and secondary separation by Wolbachia infection status. O) Heatmap showing the top four differentially expressed marker genes contributing to the PCA by Wilcoxon Rank Sum p-value, with circle size indicating the fraction of cells expressing each gene. P-Q) UMAP projections of bulk RNA-seq data onto single-cell reference atlases: P) adult Drosophila tissues and Q) Drosophila myeloid-like cells. P’ and Q’) Highlight where our bulk cell transcriptomes mapped to each atlas. Dotted outlines of where the bulk samples mapped, with the points removed, so that the alignment with cell clusters can be seen.
Figure 2.
Figure 2.
Genes and co-expressed gene networks involved in determining D. melanogaster cell type and the cellular reaction to infection state. A) Linear model fit of WGCNA eigengene modules to cell type, infection, and joint-cell type and infection states (see also Figure S7). The x- and y-axes contain the estimated linear model coefficients for the variables cell type and infection, respectively, for each WGCNA eigengene module. B) Counts of significantly differentially expressed genes per cluster (bottom x-axis and left y-axis). Counts of enriched GO terms and KEGG pathways per D. melanogaster module (top x-axis and right y-axis). Eigengene module evidence associated with C-F) S2 cell type, G-I) JW18 cell type, J-P) the uninfected JW18 cell state, and Q-T) the uninfected state. C,G,J,M,Q) Eigengene value plots for each module. KEGG enrichment network plots for each module (FDR-adjusted p-value<0.05) from E,H,K,N,O) ShinyGO and D,K) clusterProfiler. F,I,L,P,S) GO component enrichment plots for each module, plotting the top 5–10 terms by gene ratio (FDR-adjusted p-value<0.05). R) GO function enrichment plots for each module, plotting the top 5 terms by gene ratio (FDR-adjusted p-value<0.05). T) GO process enrichment plots for each module, plotting the top 5 terms by gene ratio (FDR-adjusted p-value<0.05).
Figure 3.
Figure 3.
Drosophila and Wolbachia respond to each other transcriptomically. A-D) Eigengene module evidence associated with the infected host cell state. A) Plot of D. melanogaster sample eigengene values for the infection-associated module 10. B) KEGG enrichment network plot (p ≤ 0.05). C) GO component enrichment plots for each module, plotting the top 5 terms by gene ratio (FDR-adjusted p-value<0.05). D) GO process enrichment plots for each module, plotting the top terms by gene ratio (FDR-adjusted p-value<0.05). E) Volcano plot of DESeq2 differential expression results. F) Plot of the WGCNA models linear fit to host cell type. LogFC measures the direction and magnitude of eigengene expression difference between the two cell types for wMel gene expression. The t variable on the y-axis is the moderated t-statistic from limma::eBayes() for the logFC. JW18-associated wMel Module 3 G) eigengene values, H) KEGG enrichment network plot (p ≤ 0.05), and I) GO process enrichment terms (p ≤ 0.05).
Figure 4.
Figure 4.
Wolbachia gene expression induces compensatory responses specific to host cell type. A-F) Wolbachia eigengene module evidence associated with cell type. A-C) S2-associated wMel eigengene module 2 A) values, B) KEGG enrichment network, and C) gene count plots for some of the most upregulated wMel genes in S2 cells. D-G) JW18-associated wMel eigengene module 1 D) values, E) KEGG enrichment network, F) GO process enrichment terms (p ≤ 0.05), and G) gene count plots for some of the most upregulated wMel genes in JW18 cells. D. melanogaster eigengene modules associated with wMel infection in H-P) S2 cells and in Q-V) JW18 cells. S2-wMel-associated Drosophila H, K, N) module 8, 7, and 5 eigengene values, I) module 8 KEGG enrichment network, J,L) module 8 and 7 GO function enrichment plots, M,P) module 7 and 5 GO process enrichment plots, and O) module 5 GO component enrichment plots. JW18-wMel-associated Drosophila Q,T) module 4 and 6 eigengene values, R) module 4 KEGG enrichment network, S,V) module 4 and 6 GO process enrichment plots, and U) module 6 GO component plot.
Figure 5.
Figure 5.
Genomic browser views of the Micro-C results for two representative WGCNA module co-localized regions showing multiple data tracks. Regions shown: A-F) Chromosome 3L:0.0–5.0Mb and G-L) Chromosome 2L: 6.0–9.0Mb. A,G) Top two tracks: Chromatin contact heatmaps (green intensity) for JW18 wMel-infected and JW18 uninfected cells. Orange outlines highlight significant (q < 0.1) topologically associated domains (TADs), pink outlines indicate significant contact differences (q < 0.05) between uninfected and wMel-infected JW18 cells.B,H) Middle tracks: Colored dots representing genes from identified eigengene modules. Black lines indicate regions where module genes are statistically enriched, compared to the background gene density. Module-colored vertical dashed lines mark the boundaries of enriched regions. Next two tracks: Contact probability differences between C,I) infected (dark green) and D,J) uninfected cells (light green). E,K), RNA-seq coverage differences. Bottom track: D. melanogaster genome mappability (blue).

References

    1. Medina P., Russell S.L., and Corbett-Detig R. (2023). Deep data mining reveals variable abundance and distribution of microbial reproductive manipulators within and among diverse host species. PLoS One. 10.1101/679837. - DOI - PMC - PubMed
    1. Iturbe-Ormaetxe I., Walker T., and O’ Neill S.L. (2011). Wolbachia and the biological control of mosquito-borne disease. EMBO Rep. 12, 508–518. 10.1038/embor.2011.84. - DOI - PMC - PubMed
    1. Russell S.L., Castillo J.R., and Sullivan W.T. (2023). Wolbachia endosymbionts manipulate the self-renewal and differentiation of germline stem cells to reinforce fertility of their fruit fly host. PLOS Biol. 21, e3002335. 10.1371/journal.pbio.3002335. - DOI - PMC - PubMed
    1. Foray V., Perez-Jimenez M.M., Fattouh N., and Landmann F. (2018). Wolbachia control stem cell behavior and stimulate germline proliferation in filarial nematodes. Dev. Cell 45, 198–211. 10.1101/244046. - DOI - PubMed
    1. Starr D.J., and Cline T.W. (2002). A host–parasite interaction rescues Drosophila oogenesis defects. Nature 418, 76. - PubMed

Publication types

LinkOut - more resources