[Preprint]. 2025 Jul 9:2025.05.28.656470.
doi: 10.1101/2025.05.28.656470.

Germline polymorphisms in the immunoglobulin kappa and lambda loci explain variation in the expressed light chain antibody repertoire

Affiliations

Germline polymorphisms in the immunoglobulin kappa and lambda loci explain variation in the expressed light chain antibody repertoire

Eric Engelbrecht et al. bioRxiv. .

Abstract

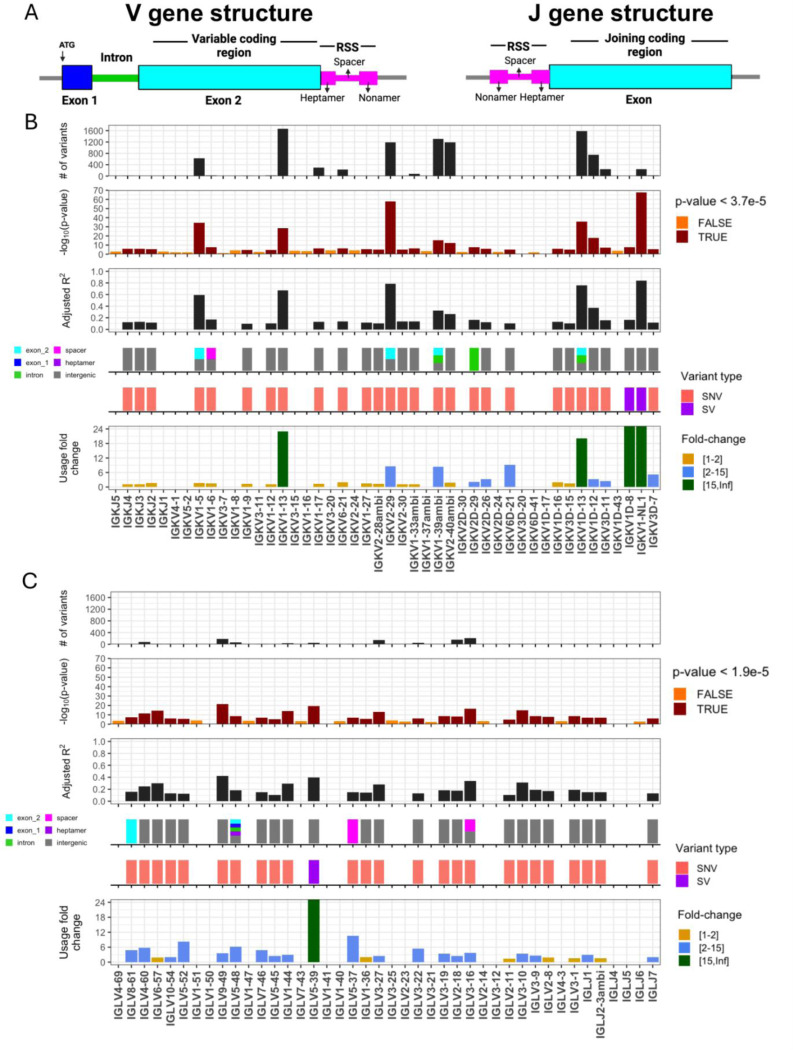
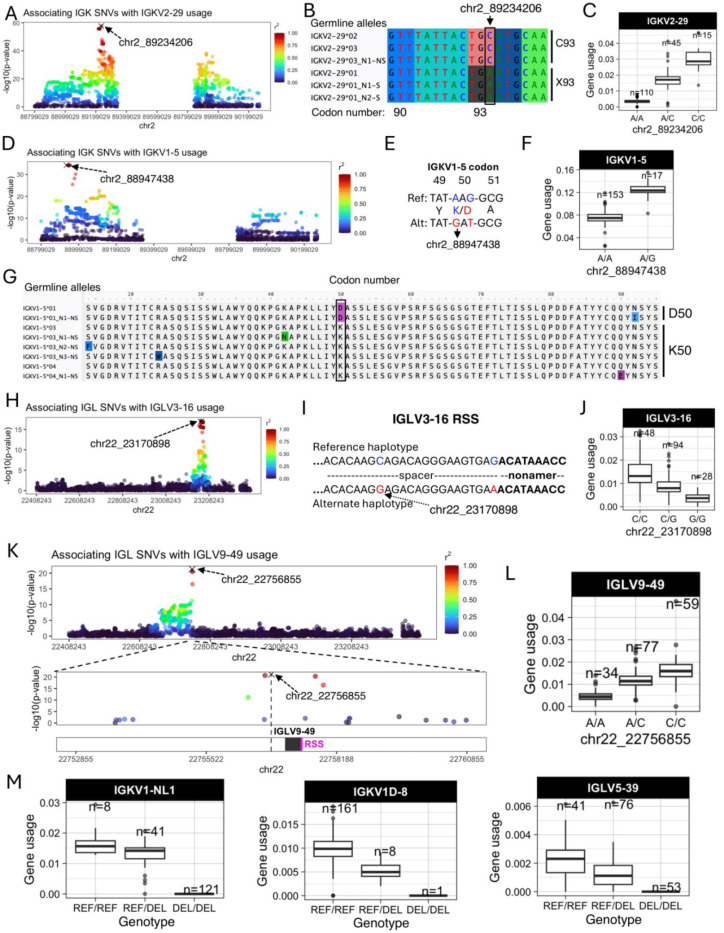
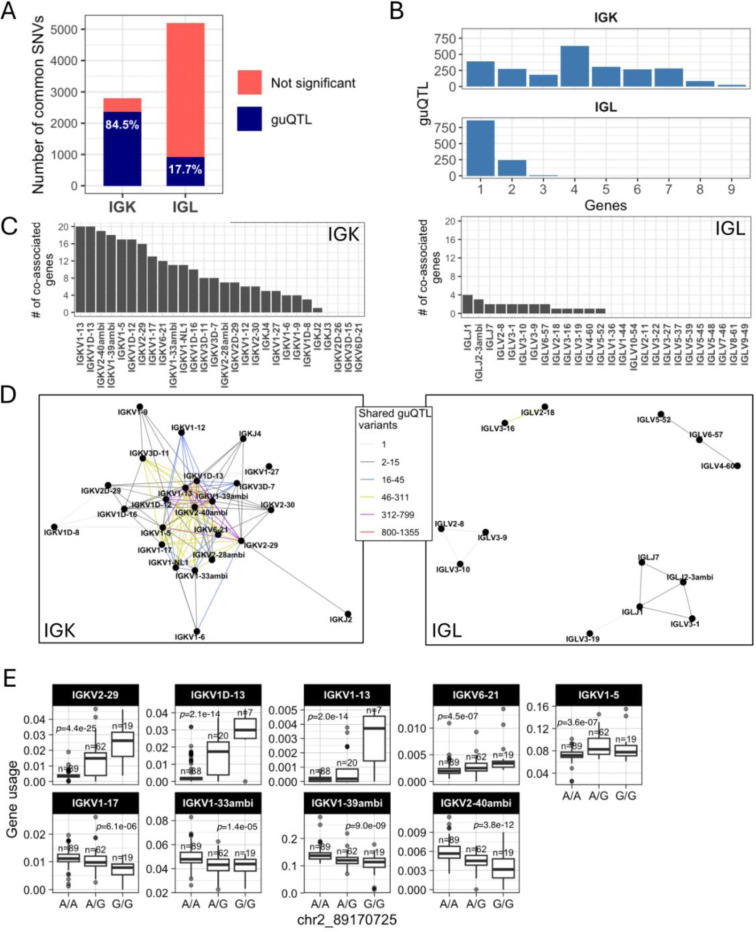
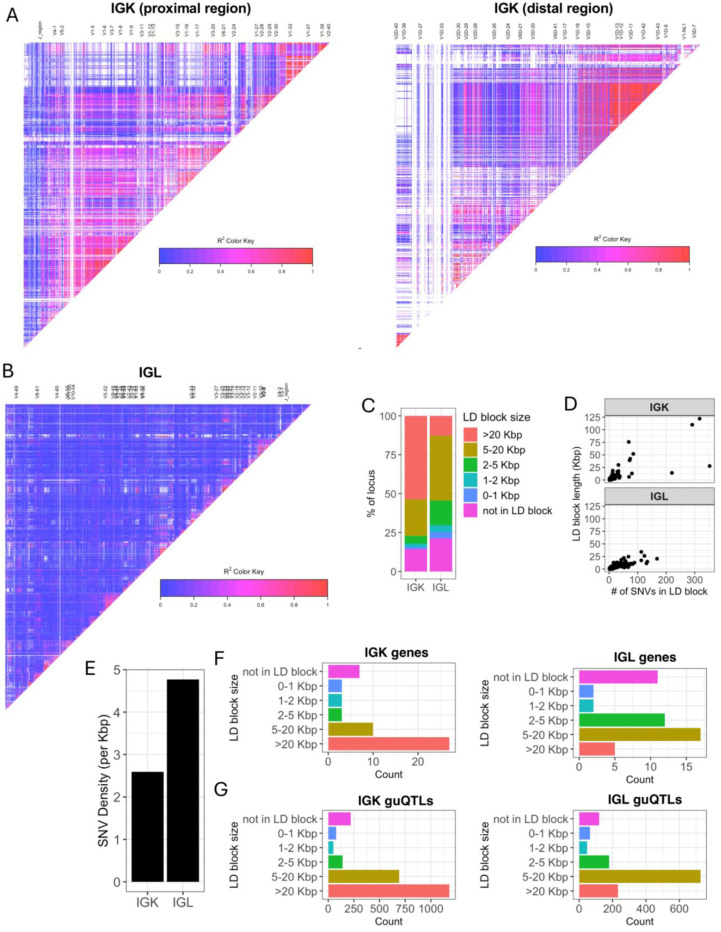
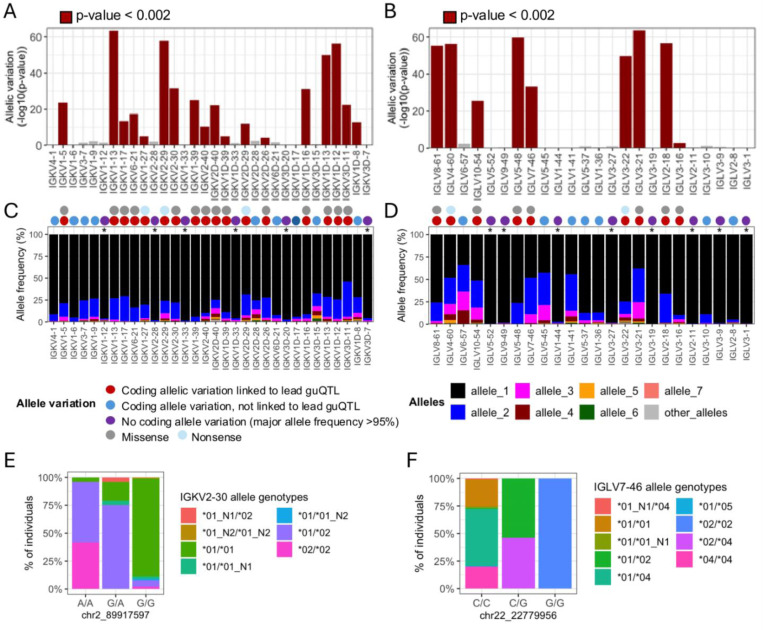
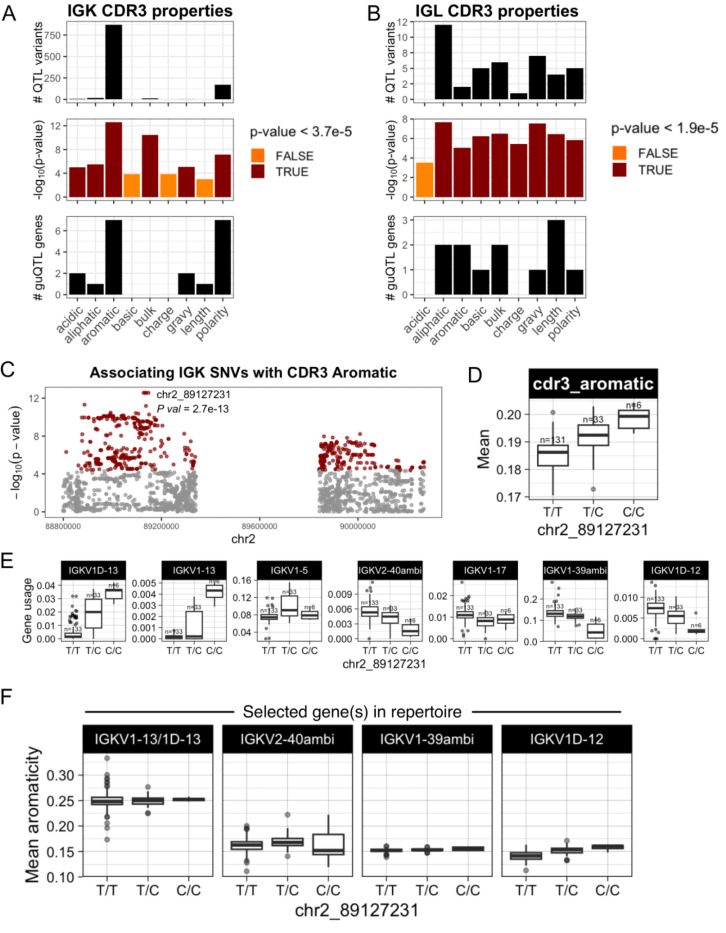
Variation in antibody (Ab) responses contributes to variable disease outcomes and therapeutic responsiveness, the determinants of which are incompletely understood. This study demonstrates that polymorphisms in immunoglobulin (IG) light chain loci dictate the composition of the Ab repertoire, establishing fundamental baseline differences that preclude functional Ab-mediated responses. Using long-read genomic sequencing of the IG kappa (IGK) and IG lambda (IGL) loci, we comprehensively resolved genetic variation, including novel structural variants, single nucleotide variants, and gene alleles. By integrating these genetic data with Ab repertoire profiling, we found that all forms of IG germline variation contributed to inter-individual gene usage differences for >70% of light chain genes in the repertoire, directly impacting the amino acids of expressed light chain transcripts, including complementarity determining region domains. The genomic locations of usage - associated variants in both intergenic and coding regions indicated that IG polymorphisms modulate gene usage via diverse mechanisms, likely including the modulation of V(D)J recombination, heavy and light chain pairing biases, and transcription/translation. Finally, relative to IGL, IGK was characterized by more extensive linkage disequilibrium and genetic co-regulation of gene usage, illuminating differential regulatory and evolutionary features between the two light chain loci. These results firmly establish the critical contribution of IG light chain polymorphism in Ab repertoire diversity, with important implications for investigating Ab responses in health and disease.


Conflict of interest statement

Competing interests C.T.W., M.L.S., and W.L. are founders and shareholders of Clareo Biosciences, Inc. and serve on its Executive Board.

Figures

Figure 1.
Figure 1.. IGK and IGL variants impact gene usage in the naïve Ab repertoire
(A) General structure of V and J genes in the IGK and IGL loci, including location of the recombination signal sequences (RSS). (B-C) Per gene (x axis, all panels) statistics from linear regression guQTL analysis for the repertoire of unmutated IGK (B) and IGL (C) light chains, including: (i) the number of associated variants after Bonferroni correction (IGK; P < 3.7e-5, IGL; P < 1.9e-5), (ii) −log10(P value) of the lead guQTL, (iii) adjusted R2 for variance in gene usage explained by the lead guQTL, (iv) the location and (v) type of variant for the lead guQTL and (vi) the fold change in gene usage between genotypes at the lead guQTL. Summary statistics are provided in Supplementary Table S6.
Figure 2.
Figure 2.. Examples of coding and non-coding lead guQTLs
(A) Manhattan plot showing the −log10(P value) for all SNVs in IGK tested for association with usage of IGKV2–29, with SNVs colored according to LD (r2) with the lead variant (marked with an X). (B) Sequence alignment of the germline IGKV2–29 alleles in this cohort from codons 90 to 95, with the lead variant indicated. Alleles encoding C93 and X93 (STOP codon) alleles are indicated. (C) Boxplot of IGKV2–29 usage in lead guQTL genotype groups. (D) Manhattan plot of associations (−log10(P value)) between all IGK SNVs and usage of IGKV1–5, with SNVs colored according to LD (r2) with the lead variant. (E) Sequence alignment of the reference and alternate haplotypes at the lead guQTL, with two missense variants in perfect LD in codon 50 indicated, resulting in K50D in the alternate haplotype. (F) Boxplot of IGKV1–5 usage in lead guQTL (shown in (E)) genotype groups. (G) Alignment of translated germline IGKV1–5 alleles with codon 50 boxed. (H) Manhattan plot of associations (−log10(P value)) between all IGL SNVs and usage of IGLV3–16, with SNVs colored according to LD (r2) with the lead variant. Two lead variants in perfect LD are in the RSS spacer. (I) Sequence of the RSS spacer in reference and alternate lead guQTL haplotypes. (J) Boxplot of IGLV3–16 usage in lead guQTL genotype groups. (K) (Top) Manhattan plot of associations (−log10(P value)) between all IGL SNVs and usage of IGLV9–49, with SNVs colored according to LD (r2) with the lead variant. (Bottom) Zoom-in on an 8 Kbp window centered on IGLV9–49 with the lead non-coding variant indicated. (L) Boxplot of IGLV9–49 usage in lead guQTL genotype groups. (M) Gene usage boxplots of genes for which the lead variant was a deletion (“DEL”) SV, including IGKV1-NL1, IGKV1D-8, and IGLV5–39.
Figure 3.
Figure 3.. Genetic coordination of IG light chain gene usage is more prevalent in IGK relative to IGL
(A) Stacked bar plot showing the proportion of total IGK and IGL common SNVs that are a guQTL. (B) Bar plot showing the number of IGK and IGL SNVs (guQTLs) significantly associated with varying numbers of genes (n = 1–9). For IGK, this includes a large number of SNVs (n=2,049) that were associated with >1 gene. (C) For each gene, the number of genes sharing at least one guQTL variant is plotted for indicated IGK (left) and IGL (right) genes (x-axis). (D-E) Network analysis identified a large clique of genes and guQTLs in IGK (D) and 4 cliques for IGL (E), demarcating groups of genes associated with overlapping sets of guQTLs. For each clique, genes are shown as nodes, connected by edges color coded according to the number of shared guQTL variants.
Figure 4.
Figure 4.. IGK has larger LD blocks and lower density of SNVs relative to IGL
(A-B) LD heatmaps of the IGK (A) and IGL (B) loci. LD blocks are illustrated as triangles. (C) Stacked bar plot of the percent of each locus (IGK, IGL) that is within LD blocks of various lengths (colors). (D) Plots of LD blocks in IGK and IGL depicting the length of each block (y-axis) and number of SNVs in each blot (x-axis). (E) Bar plot of the overall SNV density in the IGK and IGL loci. (F-G) Barplots of the counts of IGK (F) or IGL (G) genes in LD blocks with lengths indicated along y-axes.
Figure 5.
Figure 5.. Linkage between IGKV and IGLV coding region alleles and lead guQTL genotypes
(A-B) Variation in the proportion of different coding gene alleles among lead guQTL genotype groups was determined by Fisher’s exact test for guQTL genes in IGK (A) and IGL (B). Barplots shows −log10(P value). (C-D) For each gene, the frequency of coding alleles in the cohort is shown, with unique alleles color coded. Genes that lack appreciable allelic variation (major allele frequency >95%) are indicated with an asterisk. Circles above each gene indicate whether coding allele variation is linked to the lead guQTL. guQTLs linked to coding allele variation are associated with missense or nonsense variants. (E-F) Stacked bar plots showing the distributions of the respective coding allele genotypes across individuals partitioned by guQTL genotype for IGKV2–30 (E) and IGLV7–46 (F).
Figure 6.
Figure 6.. IGK and IGL variants impact CDR3 physicochemical properties in the naïve Ab repertoire
(A-B) For each CDR3 physicochemical property (x-axis), mean values were computed for each individual and tested for association (linear regression) with all common variants in IGK (A) and IGL (B). Barplots show (i) the number of QTL variants (Bonferroni-corrected) for each property, (ii) the −log10(P value) for lead variants, and (iii) the number of guQTL genes identified for the lead CDR3 property QTL variant. Summary statistics are provided in Supplementary Table S12. (C) Manhattan plot shows the −log10(P value) for all SNVs in the IGK locus tested for association with CDR3 aromaticity, with QTLs colored dark red and the lead QTL labelled. (D) Boxplot of the mean IGK CDR3 aromaticity with individuals separated by genotype at the lead QTL. (E) Boxplots of usages for seven IGK genes that are guQTLs at the lead CDR3 aromaticity variant. (F) BCR sequences that used the indicated V genes were selected from the Ab repertoire, then mean CDR3 aromaticity of each repertoire subset was computed and plotted with individuals separated by genotype at the lead CDR3 aromaticity QTL.

Similar articles

References

    1. Briney B., Inderbitzin A., Joyce C. & Burton D. R. Commonality despite exceptional diversity in the baseline human antibody repertoire. Nature 566, 393–397 (2019). - PMC - PubMed
    1. Soto C. et al. High frequency of shared clonotypes in human B cell receptor repertoires. Nature 566, 398–402 (2019). - PMC - PubMed
    1. Boyd S. D. et al. Individual variation in the germline Ig gene repertoire inferred from variable region gene rearrangements. J. Immunol. 184, 6986–6992 (2010). - PMC - PubMed
    1. Röltgen K. et al. Defining the features and duration of antibody responses to SARS-CoV-2 infection associated with disease severity and outcome. Sci. Immunol. 5, eabe0240 (2020). - PMC - PubMed
    1. Wahala W. M. P. B. & Silva A. M. de. The human antibody response to dengue virus infection. Viruses 3, 2374–2395 (2011). - PMC - PubMed

Publication types

LinkOut - more resources