[Preprint]. 2025 May 27:2025.05.22.655368.
doi: 10.1101/2025.05.22.655368.

Effect of Age on Xenobiotic-Induced Autoimmunity

Affiliations

Effect of Age on Xenobiotic-Induced Autoimmunity

Caroline de Ocampo et al. bioRxiv. .

Abstract

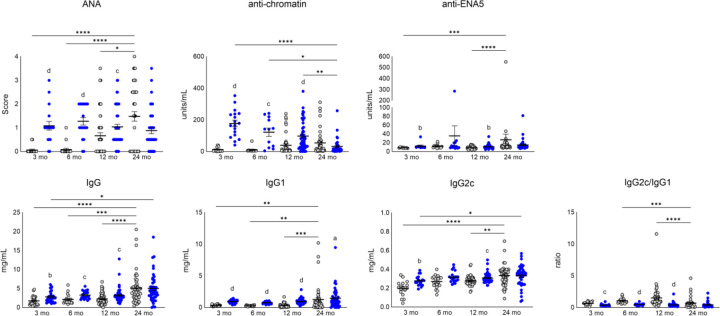
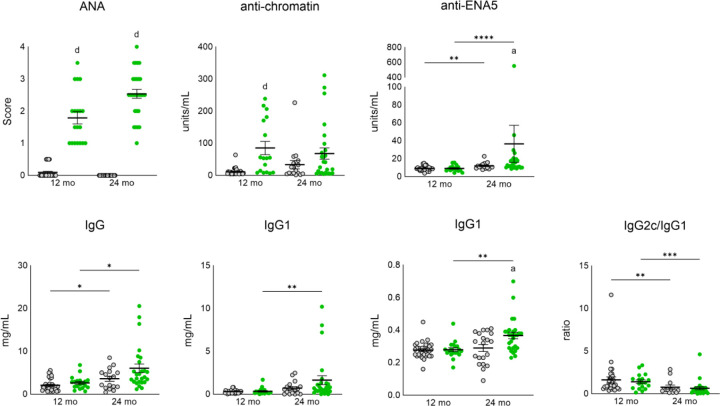
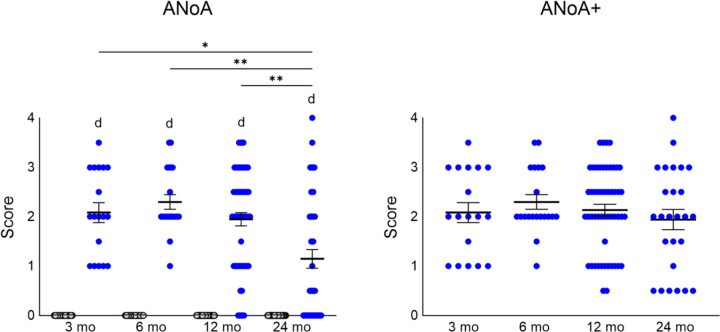
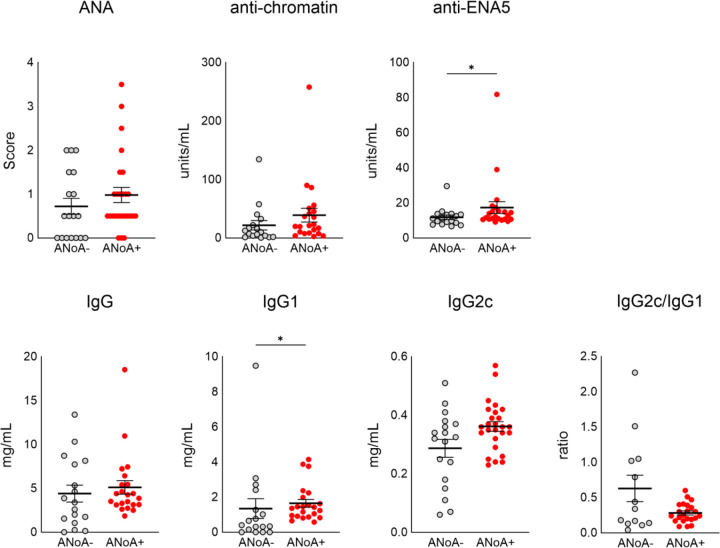
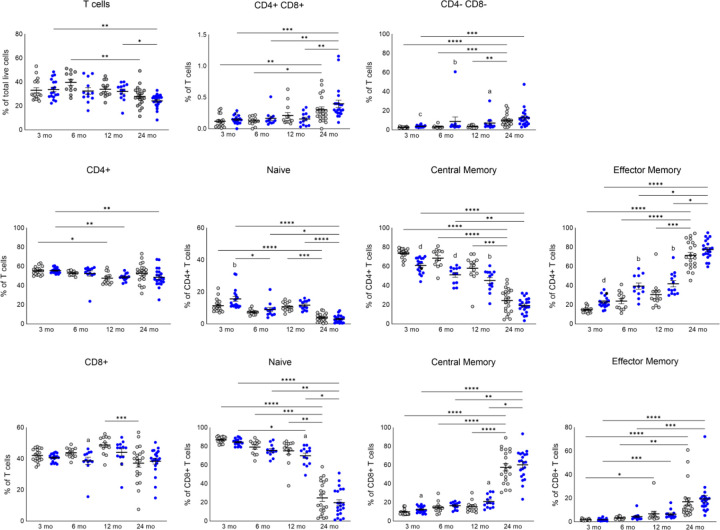
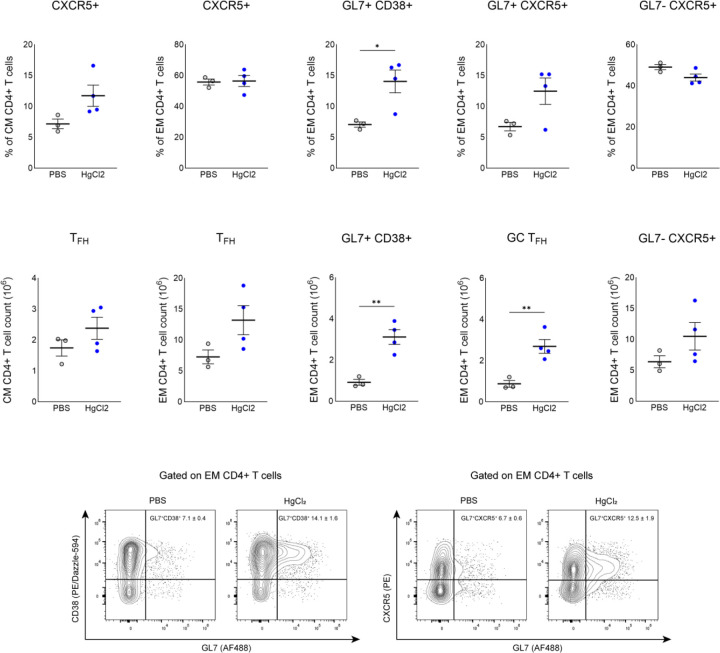
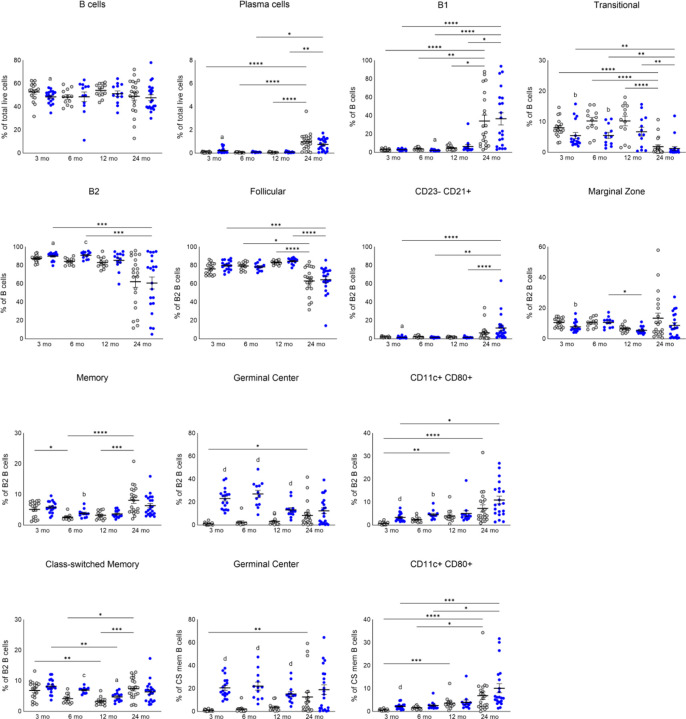
Aging is associated with increased spontaneous autoantibody production and chronic inflammation, yet its impact on xenobiotic-induced autoimmunity remains unexplored. This study investigates the effect of age on mercury-induced autoimmunity (HgIA) in B10.S mice, a model of xenobiotic-induced autoimmunity characterized by anti-nucleolar autoantibodies (ANoA). Mature (3 months), adult (6 months), middle-aged (12 months), and old-age (24 months) mice were exposed to mercury (HgCl2) or phosphate-buffered saline (PBS) for 4-5 weeks. While spontaneous anti-nuclear antibodies (ANA) increased with age in PBS-treated mice (34% in middle-aged, 57% in old age mice), HgIA incidence declined in old age mice, with only 59% (26/44) developing significant ANoA titers compared to 91-100% in younger cohorts. Notably, 56% (10/18) of initially ANoA-negative old mice had detectable ANoA at a lower dilution, indicating a reduced but not absent response. ANoA negativity in old age mice was associated with lower immunoglobulin levels, reduced anti-chromatin antibodies, and diminished germinal center formation, suggestive of immunosenescence. Flow cytometry revealed age-related declines in CD4⁺ T cells, with mercury exposure augmenting T-cell differentiation in younger but not old mice. These findings demonstrate that aging enhances spontaneous autoimmunity but impairs xenobiotic-induced autoimmunity, with a subset of old age mice retaining partial responsiveness at lower dilutions, highlighting the complex interplay between immunosenescence and environmental triggers.


Figures

Figure 1.
Figure 1.. Age and HgCl2-induced changes in autoantibodies and hypergammaglobulinemia in B10.S mice.
Sera assessment of B10.S mice at 3 (n=17/18), 6 (n=19/20), 12 (n=56/57) or 24 (n=48/44) months of age treated with PBS (gray) or HgCl2 (blue). Mice treatment and assays performed as described in Materials & Methods. Statistical comparisons between age groups were performed with Kruskal-Wallis tests. *p<0.05, **p<0.01, ***p<0.001, ****p<0.0001. Statistical comparisons of PBS and HgCl2 treatment groups were performed with Mann-Whitney U tests. a, p<0.05; b, p<0.01; c, p<0.001; d, p<0.0001.
Figure 2.
Figure 2.. Comparison of humoral immune responses in ANA negative and positive middle aged and old age B10.S mice.
Sera assessment of ANA negative (gray) and positive (green) 12 (n=32/19) and 24 (n=20/28) month old mice treated with PBS. Mice treatment and assays performed as described in Materials & Methods. Statistical comparisons between age groups were performed with Kruskal-Wallis tests. *p<0.05, **p<0.01, ***p<0.001, ****p<0.0001. Statistical comparisons of ANA negative and positive treatment groups were performed with Mann-Whitney U tests. a, p<0.05; b, p<0.01; c, p<0.001; d, p<0.0001.
Figure 3.
Figure 3.. The ANoA response requires HgCl2-exposure but does not occur in all animals with age.
Assessment of ANoA in B10.S mice at 3 (n=17/18), 6 (n=19/20), 12 (n=56/57) or 24 (n=48/44) months of age treated with PBS (gray) or HgCl2 (blue). Mice treatment and assays performed as described in Materials & Methods. Statistical comparisons between age groups were performed with Kruskal-Wallis tests. *P<0.05, **p<0.01, ***p<0.001, ****p<0.0001. Statistical comparisons of PBS and HgCl2 treatment groups were performed with Mann-Whitney U tests. a, p<0.05; b, p<0.01; c, p<0.001; d, p<0.0001.
Figure 4.
Figure 4.. Comparison of humoral immune responses in ANoA negative and positive HgCl2 exposed old age mice.
Sera assessment of ANoA negative (n=18) and ANoA positive (n=26) 24 month old mice treated with HgCl2. Mice treatment and assays performed as described in Materials & Methods. Statistical comparisons were performed with Mann-Whitney U tests. *P<0.05, **p<0.01, ***p<0.001, ****p<0.0001.
Figure 5.
Figure 5.. Changes in T cell subsets with age and HgIA.
Multicolor flow cytometry on the spleens of B10.S mice at 3 (n=18/18), 6 (n=12/12), 12 (13/13) or 24 months (n=19/23) of age treated with PBS (gray) or HgCl2 (blue). Mice treatment and assays performed as described in Materials & Methods. Statistical comparisons between age groups were performed with Kruskal-Wallis tests. *P<0.05, **p<0.01, ***p<0.001, ****p<0.0001. Statistical comparisons of PBS and HgCl2 treatment groups were performed with Mann-Whitney U tests. a, p<0.05; b, p<0.01; c, p<0.001; d, p<0.0001.
Figure 6.
Figure 6.. Activation of CD4+ T cell subsets with age and HgIA.
Multicolor flow cytometry on the spleens of B10.S mice at 3 (n=18/18), 6 (n=12/12), 12 (13/13) or 24 (n=19/23) months of age treated with PBS (gray) or HgCl2 (blue). Mice treatment and assays performed as described in Materials & Methods. Statistical comparisons between age groups were performed with Kruskal-Wallis tests. *P<0.05, **p<0.01, ***p<0.001, ****p<0.0001. Statistical comparisons of PBS and HgCl2 treatment groups were performed with Mann-Whitney U tests. a, p<0.05; b, p<0.01; c, p<0.001; d, p<0.0001.
Figure 7.
Figure 7.. Germinal center T follicular helper cells with HgIA.
Multicolor flow cytometry on the spleens of B10.S mice at 12 months of age treated with PBS (n=3) (gray) or HgCl2 (n=4) (blue). Mice treatment and assays performed as described in Materials & Methods. Statistical comparisons between PBS and HgCl2 treatment groups were performed with unpaired t-tests (black *). *P<0.05, **p<0.01, ***p<0.001, ****p<0.0001.
Figure 8.
Figure 8.. B cell subset changes with age and HgIA.
Multicolor flow cytometry on the spleens of B10.S mice at 3 (n=18/18), 6 (n=12/12), 12 (13/13) or 24 (n=19/23) months of age treated with PBS (gray) or HgCl2 (blue). Mice treatment and assays performed as described in Materials & Methods. Statistical comparisons between age groups were performed with Kruskal-Wallis tests. *P<0.05, **p<0.01, ***p<0.001, ****p<0.0001. Statistical comparisons of PBS and HgCl2 treatment groups were performed with Mann-Whitney U tests. a, p<0.05; b, p<0.01; c, p<0.001; d, p<0.0001.
Figure 9.
Figure 9.. Age-associated B cells with age and HgIA.
Multicolor flow cytometry on the spleens of B10.S mice at 3 (n=3/4), 6 (n=7/7) or 12 (11/8) months of age treated with PBS (gray) or HgCl2 (blue). Mice treatment and assays performed as described in Materials & Methods. Statistical comparisons between age groups were performed with one-way ANOVA. *P<0.05, **p<0.01, ***p<0.001, ****p<0.0001. Statistical comparisons between PBS and HgCl2 treatment groups were performed with unpaired t-tests. a, p<0.05; b, p<0.01; c, p<0.001; d, p<0.0001.
Figure 10.
Figure 10.. non T or B cell type changes with age and mHgIA.
Multicolor flow cytometry on the spleens of B10.S mice at 3 (n=18/18), 6 (n=12/12), 12 (13/13) or 24 (n=19/23) months of age treated with PBS (gray) or HgCl2 (blue). Mice treatment and assays performed as described in Materials & Methods. Statistical comparisons between age groups were performed with Kruskal-Wallis tests. *P<0.05, **p<0.01, ***p<0.001, ****p<0.0001. Statistical comparisons of PBS and HgCl2 treatment groups were performed with Mann-Whitney U tests. a, p<0.05; b, p<0.01; c, p<0.001; d, p<0.0001.
Figure 11.
Figure 11.. Spontaneous ANA is reflected in spleen cell populations in middle aged mice.
Multicolor flow cytometry on the spleens of ANA− (gray) and ANA+ (green) 12 (10/3) and 24 (11/10) month old B10.S mice treated with PBS. Mice treatment and assays performed as described in Materials & Methods. Statistical comparisons between age groups were performed with ANOVA tests. *P<0.05, **p<0.01, ***p<0.001, ****p<0.0001. Statistical comparisons of PBS and HgCl2 treatment groups were performed with unpaired t-tests. a, p<0.05; b, p<0.01; c, p<0.001; d, p<0.0001.
Figure 12.
Figure 12.. ANoA− and ANoA+ responses to HgCl2 are reflected in spleen cell populations in old mice.
Multicolor flow cytometry on the spleens of ANoA− (n=7) and ANoA+ (n=16) 24 month old B10.S mice. Mice treatment and assays performed as described in Materials & Methods. Statistical comparisons between ANoA negative and positive mice were performed with unpaired t-tests. *P<0.05, **p<0.01, ***p<0.001, ****p<0.0001.

Similar articles

References

    1. Miller F.W., et al. , Epidemiology of environmental exposures and human autoimmune diseases: Findings from a National Institute of Environmental Health Sciences Expert Panel Workshop. J Autoimmun, 2012. 39(4): p. 259–71. - PMC - PubMed
    1. Pollard K.M., et al. , Mechanisms of Environment-Induced Autoimmunity. Annu Rev Pharmacol Toxicol, 2021. 61: p. 135–157. - PMC - PubMed
    1. Pollard K.M., et al. , Environmental Xenobiotic Exposure and Autoimmunity. Curr Opin Toxicol, 2018. 10: p. 15–22. - PMC - PubMed
    1. Pollard K.M., Silica, Silicosis, and Autoimmunity. Front Immunol, 2016. 7: p. 97. - PMC - PubMed
    1. Pollard K.M., et al. , Mercury-induced inflammation and autoimmunity. Biochim Biophys Acta Gen Subj, 2019. - PMC - PubMed

Publication types