[Preprint]. 2025 Jun 3:2025.05.30.657091.
doi: 10.1101/2025.05.30.657091.

CTCF maintains pericentromere function and mitotic fidelity

Affiliations

CTCF maintains pericentromere function and mitotic fidelity

Erin Walsh et al. bioRxiv. .

Abstract

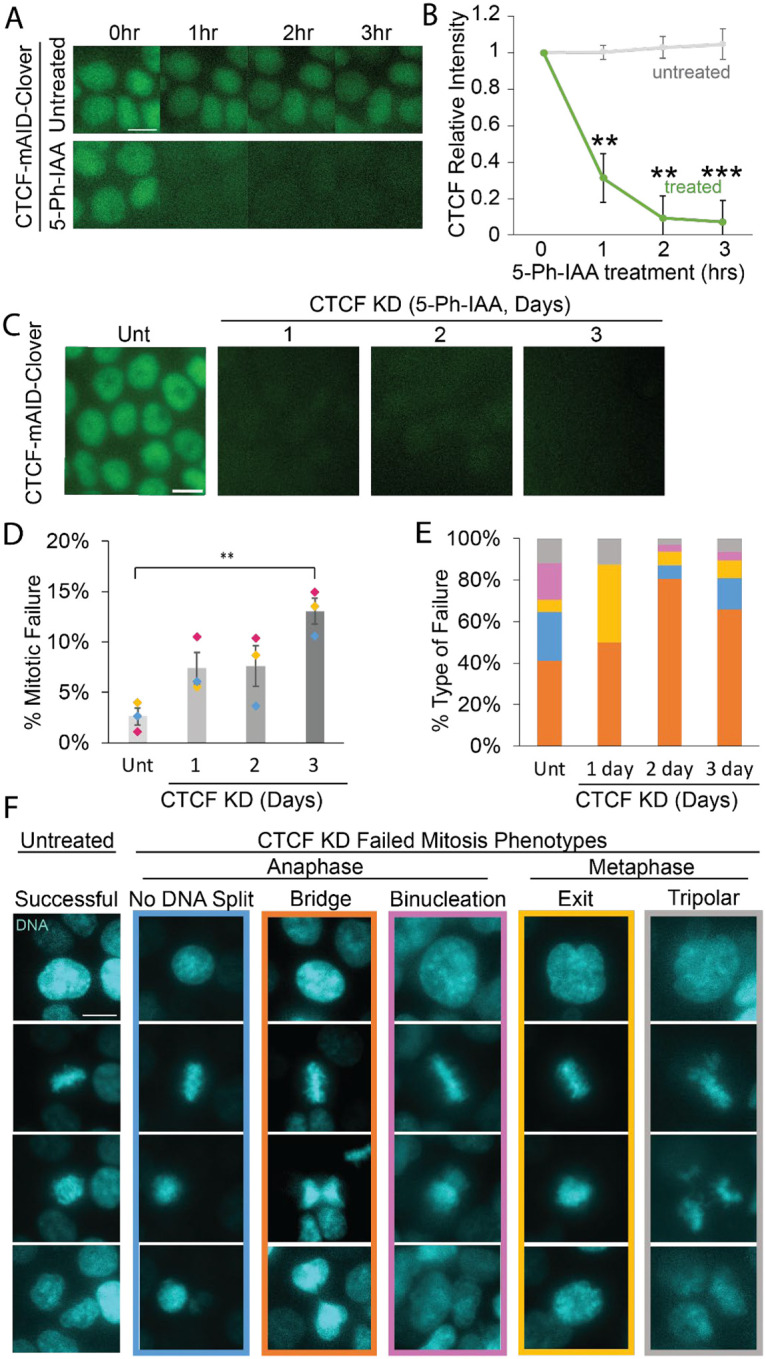
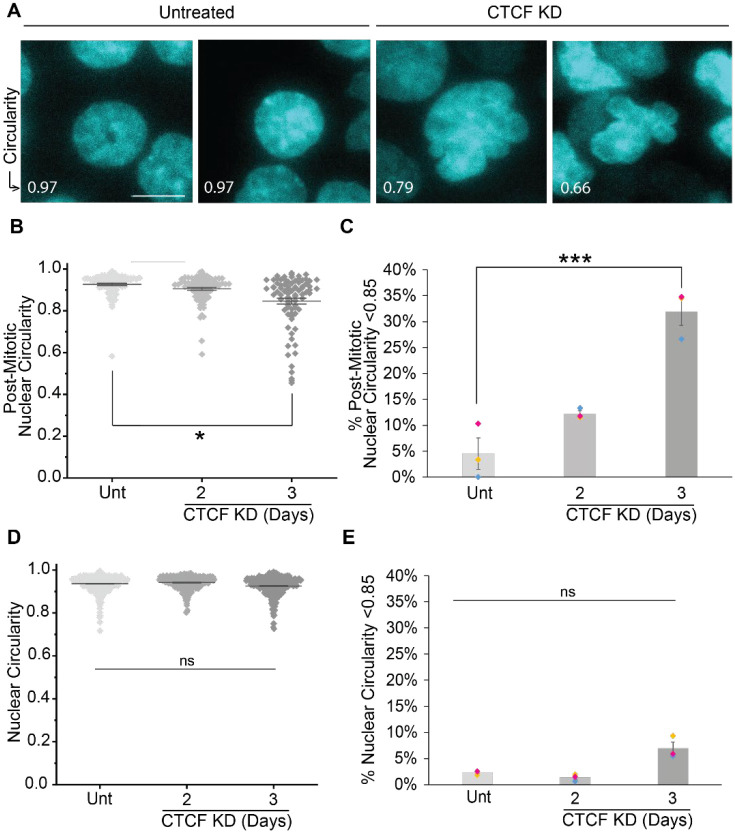
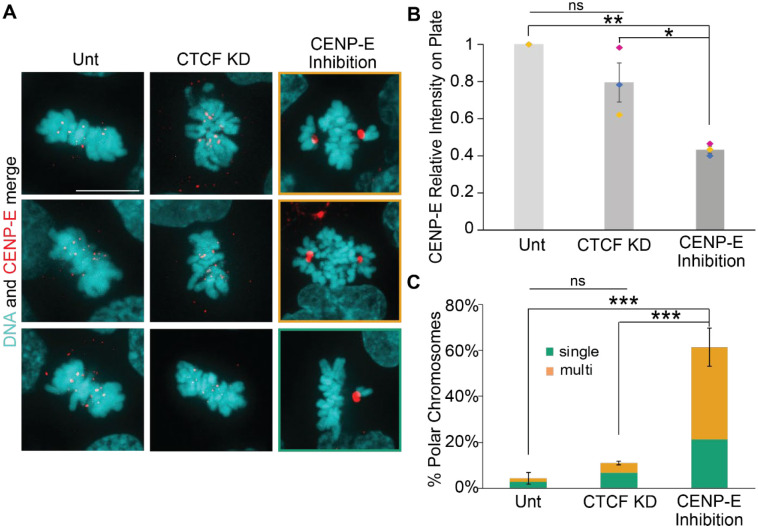
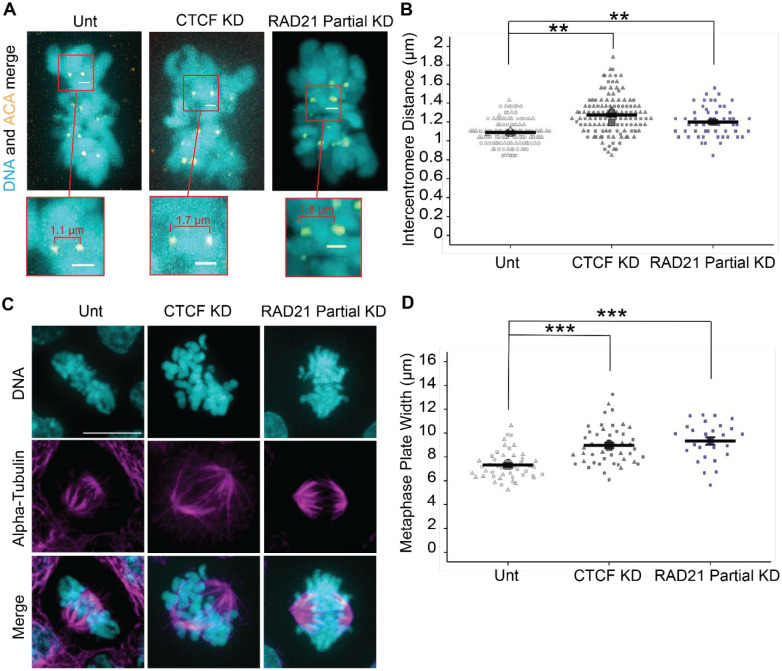
In mitosis the duplicated genome is aligned and accurately segregated between daughter nuclei. CTCF is a chromatin looping protein in interphase with an unknown role in mitosis. We previously published data showing that CTCF constitutive knockdown causes mitotic failure, but the mechanism remains unknown. To determine the role of CTCF in mitosis, we used a CRISPR CTCF auxin inducible degron cell line for rapid degradation. CTCF degradation for 3 days resulted in increased failure of mitosis and decreased circularity in post-mitotic nuclei. Upon CTCF degradation CENP-E is still recruited to the kinetochore and there is a low incidence of polar chromosomes which occur upon CENP-E inhibition. Instead, immunofluorescence imaging of mitotic spindles reveals that CTCF degradation causes increased intercentromere distances and a wider and more disorganized metaphase plate, a disruption of key functions of the pericentromere. These results are similar to partial loss of cohesin, an established component of the pericentromere. Thus, we reveal that CTCF is a key maintenance factor of pericentromere function, successful mitosis, and post-mitotic nuclear shape.


Conflict of interest statement

Competing interests The authors declare not competing interests.

Figures

Figure 1.
Figure 1.. CTCF-mAID-Clover degradation causes increased mitotic failure rates mainly through anaphase failure.
(A) Example images and (B) graph of CTCF-mAID-Clover relative fluorescence intensity at 0, 1, 2 and 3 hours in untreated (Unt) and 5-Ph-IAA treated. n >70 nuclei for each of 3 replicates. (C) Image examples CTCF-mAID-Clover fluorescence in untreated nuclei and nuclei treated with 5-Ph-IAA for 1, 2, and 3 days. (D) Graph of the rate of mitotic failure in untreated, 1-, 2-, and 3-day treatment with 10 μM 5-Ph-IAA. Data from three biological replicates shows failure levels of unt (8/199, 2/175, 6/223), 1 day (21/302), 2-day (14/161, 15/144, 5/135), and 3-day (14/103, 16/107, 16/151) treatment of 5-Ph-IAA for CTCF knockdown (CTCF KD). (E) Graph of the percentage of each type of mitotic failure in untreated, 1-, 2-, and 3-day CTCF KD. Colors represent the types of failures shown in panel F. The main phenotype, anaphase failure with DNA separation, are seen in untreated (7/17), 1 day (12/22), 2 day (25/31), and 3 day (31/47). (F) Example images of the 5 phenotypes of mitosis used to categorize mitotic failure or success. Images of nuclei stained with SPY-DNA and represented in cyan were taken from time lapse videos. Error bars represent standard error. Statistical tests are unpaired two-tailed Student’s t-test for panel B and E and ANOVA and Post Hoc Tukey tests for panel D. Significance is represented by *p < 0.05, **p < 0.01, and ***p < 0.001, and ns represents no statistical significance. Scale bar = 10 μm.
Figure 2.
Figure 2.. CTCF knockdown after 3 days causes decreased nuclear circularity post-mitosis.
(A) Example images highlighting the circularity differences between untreated and 3-day 5-Ph-IAA treatment for CTCF knockdown (CTCF KD). Nuclei are marked with SPY-DNA (cyan) and circularity measurement is shown in the bottom left corner. Scale bar is 10 μm. (B) Graph of post-mitotic circularity measurements 1.5 hours after anaphase onset of untreated (Unt) and 2 or 3 days CTCF knockdown. (C) Graph of the percentage of nuclei with post-mitotic nuclear circularity < 0.85. The data from B and C are from three replicates each with n > 16 from the 16-hour time lapse. Post-mitotic nuclear circularity < 0.85 in untreated (5/89), 2-day (11/90), and 3-day (27/82) CTCF KD. (D,E) Graphs of (D) nuclear circularity measurements and (E) percentage of nuclei with circularity < 0.85 to denote abnormal for untreated and 2- or 3-day CTCF KD. Data are measured from total nuclei population at one time point for three replicates each with n > 350. Number of nuclei below the threshold are untreated (11/461), 2-day (5/379), 3-day (28/423) CTCF KD. Statistical tests for panel B were Kruskal Wallis and Dunns tests. Statistical tests for C-E were ANOVAs followed by Post Hoc Tukey tests. Error bars represent standard error. Significance is represented by *p < 0.05, **p < 0.01, and ***p < 0.001, and ns represents no statistical significance.
Figure 3.
Figure 3.. CENP-E intensity and chromosome congression remain intact upon CTCF knockdown.
(A) Metaphase example images of CENP-E immunofluorescence (red) and DNA stained with Hoechst (cyan) in untreated (Unt), CTCF KD via 3-day 5-Ph-IAA treatment, and CENP-E inhibitor GSK-923295 treatment 10nm for 1 day. Scale bar is 10 μm. (B) Graph of CENP-E relative intensity on metaphase plate chromosomes in untreated, CTCF KD, and GSK-923295. Data are from 3 biological replicates with n>12 for each replicate. (C) Graph of the percentage of polar chromosomes and categorizations of single (green) or multiple (orange) polar chromosome pairs present in untreated, CTCF KD, and GSK-923295. Data for polar chromosomes represents three replicates with n>15 for each replicate. Polar chromosomes are present in untreated (3/69), 3-day CTCF KD (5/27), GSK-923295 (63/98). Statistical tests for panel B and C ANOVAs followed by Post Hoc Tukey tests. Error bars represent standard error. Significance is represented by *p < 0.05, **p < 0.01, and ***p < 0.001, and ns represents no statistical significance.
Figure 4.
Figure 4.. Intercentromere distance and metaphase plate width increase with CTCF knockdown and RAD21 partial knockdown.
(A) Example images of sister centromere pairs and (B) graph of intercentromere distances in metaphase plates in untreated (Unt), 3-day 5-Ph-IAA (CTCF KD), and RAD21 partial knockdown via 6 hours 5-Ph-IAA 357μM treatment. DNA is stained with Hoechst (cyan) and the centromere is marked by ACA immunofluorescence (yellow). Scale bar is 1 μm. Data for unt and CTCF KD are from three biological replicates with n>10 for each replicate. Data for RAD21 partial KD are from one biological replicate with n>26. RAD21 partial knockdown data is provided in Supplemental Figure 1F. (C) Example images of metaphase plates in which DNA is stained with Hoechst (cyan), and immunofluorescence marks alpha tubulin (magenta) in untreated, CTCF KD, RAD21 partial KD. Scale bar is 10 μm. (D) Graph of metaphase plate width. Data for Unt and CTCF KD are from three biological replicates with n>15 and RAD21 partial KD are from one replicate n= 16. Statistical tests run were unpaired two-tailed Student’s t-tests between untreated and each KD. Error bars represent standard error. Significance is represented by *p < 0.05, **p < 0.01, and ***p < 0.001, and ns represents no statistical significance.

Similar articles

References

    1. Andrade Ruiz L, Kops GJPL, and Sacristan C (2024). Vertebrate centromere architecture: from chromatin threads to functional structures. Chromosoma 133, 169–181. - PMC - PubMed
    1. Banigan EJ, Tang W, van den Berg AA, Stocsits RR, Wutz G, Brandão HB, Busslinger GA, Peters J-M, and Mirny LA (2023). Transcription shapes 3D chromatin organization by interacting with loop extrusion. Proc Natl Acad Sci U S A 120, e2210480120. - PMC - PubMed
    1. Barisic M, Aguiar P, Geley S, and Maiato H (2014). Kinetochore motors drive congression of peripheral polar chromosomes by overcoming random arm-ejection forces. Nat Cell Biol 16, 1249–1256. - PubMed
    1. Bennett A, Bechi B, Tighe A, Thompson S, Procter DJ, and Taylor SS (2015). Cenp-E inhibitor GSK923295: Novel synthetic route and use as a tool to generate aneuploidy. Oncotarget 6, 20921–20932. - PMC - PubMed
    1. Bunning AR, and Gupta ML Jr (2023). The importance of microtubule-dependent tension in accurate chromosome segregation. Front Cell Dev Biol 11, 1096333. - PMC - PubMed

Publication types

LinkOut - more resources