[Preprint]. 2025 Jun 2:2025.05.09.653099.
doi: 10.1101/2025.05.09.653099.

Decay drives RNA abundance regulation using three distinct regulatory mechanisms

Affiliations

Decay drives RNA abundance regulation using three distinct regulatory mechanisms

Reed S Sorenson et al. bioRxiv. .

Abstract

RNA decay is essential for maintenance of normal RNA abundances; however how RNA decay is regulated to contribute to changes in RNA abundances is poorly understood. Here, we addressed this question by analyzing rates of RNA abundance change, RNA halflives (t 1/2s), and transcription rates in stimulated Arabidopsis leaf cells. This revealed three mechanisms by which decay influenced RNA abundance changes. First, the biggest changes in RNA abundances resulted from t 1/2 changes that reinforced transcriptional regulation (synergistic). Modest RNA abundance changes arose from a second mechanism in which t 1/2 changes opposed transcriptional regulation (oppositional). Finally, RNA decay alone also contributed to RNA abundance change, and RNA decay's measured capacity influence RNA abundances was similar to that of transcription. RNA decay also contributed to transcriptome homeostasis through stimulus-induced RNA buffering. Oppositional and buffering regulation shared key features, including excessive and commensurate rate changes, which suggested use of a shared regulatory mechanism which we call countercyclical regulation. In this study, countercyclical regulation was widespread and used for regulation of 90% of the RNAs with t 1/2 regulation.

Keywords: RNA buffering; RNA decay; RNA half-life (t1/2); countercyclical; nuclear-cytoplasmic coordination; transcription; transcriptome homeostasis; vascular transdifferentiation.


Figures

Figure 1.
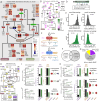
Figure 1.. Vascular developmental stimulus induces active cellular reprogramming at 8 h.
(A) Effect of stimulus on an early procambial marker. YFP fluorescence was measured as mean pixel intensity x 10−3 from 2 mm diameter leaf disks of proAtHB8::4xYFP plants over 24 h treatment. (B) Effect of stimulus on relative RNA abundance of vascular differentiation markers. RNA abundance was measured by qRT-PCR over 20 h of treatment and normalized to the UBC10 reference RNA. (C) Pie chart showing the proportions of RNAs with increased or decreased RNA abundance (FDR < 0.05) by RNA-seq at 8 h stimulus treatment compared with mock. (D) Effect of stimulus on RNA abundances of members of the ‘phloem or xylem histogenesis’, ‘response to auxin’, ‘thylakoid’, and ‘response to light stimulus’ gene ontologies . Color squares represent log2 relative RNA abundance (LFC) of GO members. BP, biological process; CC, cellular component. (E, F) Stimulus-induced changes in leaf vascular cell-identity (E) and mesophyll (F) markers. Box plot of log2 relative RNA abundance change (8 h stimulus vs mock) of markers identified by leaf single cell RNA-seq clusters generated by Kim et al (2021). (G) Experimental design schematic for RNA abundance and RNA decay analysis. (H) Pie chart showing proportion of RNAs with increased, decreased, or unchanged half-lives. (I) Distribution of t1/2 changes. (J,K) Decay plots showing RNA abundance changes after inhibition of transcription (thin lines, mean±SE) and t1/2 estimates based on modeled decay (thick lines) of 8 h stimulus- (blue and red) and mock-treated (black) leaves. (L) Distribution of t1/2 (8 h mock, black dots) and shift in t1/2 (line segments) for 2,818 RNAs with shifted t1/2s in the standard range. Line segment endpoints are positioned at the mock and stimulus t1/2s. Line color indicates log2 relative abundance (LFC). See Figure S5A for enlargement of the 100 shortest and longest mock half-lives. Numbered line segments indicate RNAs that have much shorter or longer half-lives in stimulus: (1) Protein kinase family protein with leucine-rich repeat (AT1G35710), (2) TIR-NBS-LRR Disease resistance protein (AT4G36150), (3) CCCH-type zinc finger (AT5G58620), (4) hypothetical protein (AT2G07779), (5) hypothetical protein (AT5G66580), (6) snoRNA (AT1G32385), (7) FTSH11 (AT5G53170), (8) BTB/POZ domain-containing protein (AT5G59140), (9) CID4 (AT3G14010), (10) TRM8 (AT5G26910), (11) transcriptional regulator of RNA PolII, SAGA, subunit (AT4G33890), (12) Disease resistance protein (TIR-NBS-LRR class) (AT4G16900).
Figure 2.
Figure 2.. Broad regulation of RNA decay and rate of abundance change (RoAC) occurs during stimulus response.
(A) Effect of stimulus response on members of the early vascular regulator gene network. Heatmap of relative RNA abundance (8h stimulus vs. mock). Color and numbers indicate log fold change and fold change, respectively. Bold numbers indicate significant changes (FDR < 0.05). *, ATHB8 is represented in two locations on the map. ‡, TMO6 is also represented twice. (B) t1/2 regulation in the EVR network (as in (A)). Color indicates t1/2. 11 RNAs shifted t1/2 and are indicated by a black outline and label. (C) Schematic of RNA regulation occurring for EVR network RNAs with higher (top) or lower (bottom) abundance (FDR < 0.05). (D) Schematic for determining rates of abundance change. Mock- and stimulus-treated tissue were collected after 6, 7, 8, 9, or 10 h to model the RoAC across the 8 h time point for each RNA. (E) Distributions of RoAC for RNAs that were decreasing (left) or increasing (right) abundance at 8 h mock (top) or stimulus (bottom). (F) Venn diagram showing RNAs with changing abundances in mock or stimulus. (G) Pie chart showing the effect of stimulus on RoAC; rates increased (faster), decreased (slower), or were the same. (H) Net effect of RNA regulatory mechanisms on RoAC (8 h stimulus vs. mock) in the EVR network (as in (A)). Positive or negative influence was found on rates of the 23 labeled RNAs. (I-L) RNAs of the EVR network reveal distinct regulatory modalities through changes in transcription and decay rates as indicated by arrows: red,
Figure 3.
Figure 3.. Transcriptome-wide snapshot of 8h stimulus response includes active regulatory modalities and steady abundances maintained through changes in flux.
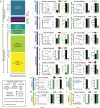
(A) Regulatory modalities are defined by change or lack of change in synthesis and decay and the net effect on rate of RNA abundance change (RoAC). Counts (and proportions) of RNAs exhibiting behavior of each regulatory modality are presented as a stacked bar plot. (B-I) Regulation patterns of faster or slower synthesis and/or decay are demonstrated for each regulatory modality and are represented pictographically as larger red (faster TR/shorter t1/2) or smaller blue (slower TR/longer t1/2) arrows on either side of an oval. Ovals represent RNA abundance. Green arrows around the ovals represent increasing or decreasing RoAC. For each example RNA, abundance measurements (RPKM mean±SE) at 6, 7, 8, 9, 10 h of mock (thin light gray line) and stimulus (thin dark gray line) along with linear models of RoAC are shown for mock (thick black line) and stimulus (thick green line). Model parameters label the graphs: s, slope of the linear model (RPKM h-1); p, slope p-value; *, indicates a significant difference at the given time point, FDR < 0.05. TR and t1/2 are also shown in bar plots to the right for mock (m), and stimulus (s).
Figure 4.
Figure 4.. Dynamic range in transcription and t1/2 regulation are modality dependent.
(A-C,E-G, K) Contributions of transcription and decay regulation for individual RNAs. Stacked bar plots show direct comparison of regulation of TR and t1/2 for each RNA of regulatory modalities; bars indicate direction and size of log2 relative TR (purple) and log2 relative t1/2 (orange). Black dots indicate net regulation (sum of the LFC rel. TR and LFC rel. t1/2). Genes within each regulatory modality are organized by increasing net regulation. The net regulation extremes that slightly deviate from 0 in the buffered RNAs reflects abundance variance below the cutoff. (D,H-J) Magnitudes of log changes in t1/2 were modeled as a function of the log change magnitudes of TR. Model fitting parameters are shown.
Figure 5.
Figure 5.. Synergistic and oppositional modalities drive responsive RNA abundance.
(A) RNA abundance response profiles. k-means clustering of 4,268 RNAs of the transcription, decay, synergistic, and oppositional modalities. Abundance data of each RNA was normalized to the total (sum) abundance of all time points so clustering would group RNAs with similar abundance response profiles independent of level of expression. Clusters were ordered and numbered based on the relative abundance difference between mock (gray lines) and stimulus (green lines). Cluster number and size label each plot; label color indicates abundance trajectories at 8 h: diverging (blue), converging (pink), or other (black). (B) Modality enrichment for RNAs of diverging or converging abundance clusters in (A) were grouped and evaluated for enrichment (blue) or depletion of the synergistic and oppositional regulatory modalities by the hypergeometric test; enrichment/depletion are displayed as a heatmap and labeled with -log10 p-values. (C) Box and whisker plot of the abundance change magnitudes (|L2FC abundance|) by regulatory modality. Abundances of all stimulus time points were compared to those of all the mock time points. (D) Enrichment analysis of RNA groups with distinct changes in t1/2 in vcs mutants: vcs feedback decay (rel. t1/2 vcs/WT < 1), moderate VCS−dependence (rel. t1/2 vcs/WT > 1 & < 2), high VCS−dependence (rel. t1/2 vcs/WT > 2). Significant enrichments are labeled with -log10 p-values.

Similar articles

References

    1. Hsu C.L., and Stevens A. (1993). Yeast Cells Lacking 5’→3’ Exoribonuclease 1 Contain mRNA Species That are Poly(A) Deficient and Partially Lack the 5’ Cap Structure. Mol. Cell. Biol. 13, 4826–4835. 10.1128/mcb.13.8.4826-4835.1993. - DOI - PMC - PubMed
    1. Kastenmayer J.P., and Green P.J. (2000). Novel features of the XRN-family in Arabidopsis: Evidence that AtXRN4, one of several orthologs of nuclear Xrn2p/Rat1p, functions in the cytoplasm. Proc. Natl. Acad. Sci. 97, 13985–13990. - PMC - PubMed
    1. Zhang W., Murphy C., and Sieburth L.E. (2010). Conserved RNaseII domain protein functions in cytoplasmic mRNA decay and suppresses Arabidopsis decapping mutant phenotypes. Proc. Natl. Acad. Sci. U. S. A. 107, 15981–15985. 10.1073/pnas.1007060107. - DOI - PMC - PubMed
    1. Anderson J.S., and Parker R.P. (1998). The 3’ to 5’ degradation of yeast mRNAs is a general mechanism for mRNA turnover that requires the SKI2 DEVH box protein and 3’ to 5’ exonucleases of the exosome complex. EMBO J. 17, 1497–1506. 10.1093/emboj/17.5.1497. - DOI - PMC - PubMed
    1. Xu J., and Chua N.-H. (2012). Dehydration stress activates Arabidopsis MPK6 to signal DCP1 phosphorylation. EMBO J. 31, 1975–1984. 10.1038/emboj.2012.56. - DOI - PMC - PubMed

Publication types

LinkOut - more resources