[Preprint]. 2025 Jun 8:2025.06.04.657954.
doi: 10.1101/2025.06.04.657954.

Transposon-plasmid nesting enables fast response to fluctuating environments

Affiliations

Transposon-plasmid nesting enables fast response to fluctuating environments

Yuanchi Ha et al. bioRxiv. .

Abstract

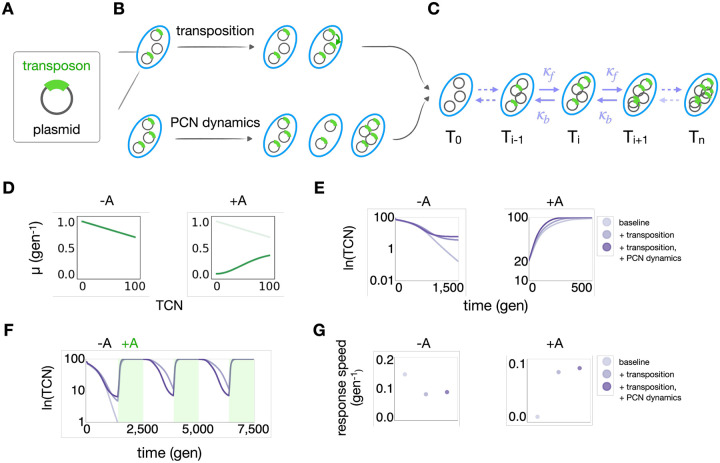
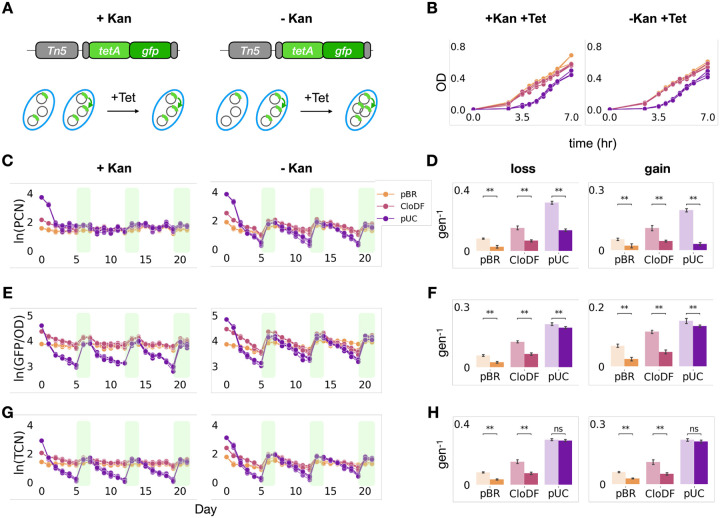
Mobile genetic elements (MGEs) play a critical role in shaping the response and evolution of microbial populations and communities. Despite distinct maintenance mechanisms, different types of MGEs can form nested structures. Using bioinformatics analysis of 14,338 plasmids in the NCBI RefSeq database, we found transposons to be widespread and significantly enriched on plasmids relative to chromosomes, highlighting the prevalence of transposon-plasmid nesting. We hypothesized that this nested structure provides unique adaptive advantages by combining transposition-driven genetic mobility with plasmid-mediated copy number amplification. Using engineered transposon systems, we demonstrated that nesting enables rapid and tunable responses of transposon-encoded genes in fluctuating environments. Specifically, transposition maintains a reservoir of the encoded genes, while plasmid copy number fluctuations further amplify the dynamic range of gene dosage, thus enhancing the response speed and stability of transposon-encoded traits. Our findings demonstrate an adaptive benefit of transposon-plasmid nesting and provide insights into their ecological persistence and evolutionary success.


Conflict of interest statement

Disclosure and competing interests statement The authors declare that they have no conflict of interest.

Figures

Figure 1.
Figure 1.. Transposon-plasmid nesting is highly prevalent
A. Bioinformatics analysis of the number of transposases per Mbp of 14,338 plasmids from 4,317 bacterial and archaeal genomes. Results show that transposons are five times more likely to be on plasmids than on chromosomes, when normalized by DNA length. B. Bioinformatics analysis of the existence of transposons on all plasmids, classified by the plasmid copy number (PCN). The y-axis is the log10(PCN), binned into 4 categories. The x-axis is the proportion of plasmids containing transposons in each category.
Figure 2.
Figure 2.. Modeling predicted that nesting enabled stable and fast transposon responses
A. Illustration of transposon-plasmid nesting. B. Illustration of how transposition increases the transposon copy number (TCN, top row) and how variations PCN drive those in the TCN (bottom row). C. Modeling framework. A subpopulation with TCN of i can transition to subpopulations i+1 or i-1, indicated by the arrows, and Ti denotes the size of the i-th subpopulation. Transition rates are indicated by κf and κb. D. Dependence of the growth rates (μ) of subpopulations carrying varying numbers of transposons. Without selection (left), we assume μ is a decreasing function of the transposon copy number. With selection, we assume μ increases with TCN following a Hill function. E. Simulated dynamics of TCN in fixed environments, under three different configurations: 1. Baseline: no transposition or PCN change (κf=0.1,κb=0.1); 2. With transposition but no PCN change (κf=0.15,κb=0.1); 3. With both transposition and PCN change (κf=0.3,κb=0.2). The left panel shows dynamics in the absence of selection; the right panel shows that in the presence of selection. Time is measured in units of generations. F. Simulated dynamics of TCN in fluctuating selection environments under the same three configurations. The third configuration (κf=0.3,κb=0.2) is the most responsive over time. G. Calculated response rates of all three populations. The baseline population has the highest loss rate and the lowest gain rate. Population with only transposition has the lowest loss rate. Population with transposition and plasmid copy number variation has higher loss rate than the second community and the highest gain rate overall.
Figure 3.
Figure 3.. Experimental validation using synthetic systems of transposon-plasmid nesting
A. Illustration of the engineered system. B. The growth curves of strains containing different plasmids with transposase on the chromosome (left) or not (right). C. Temporal dynamics of OD-normalized GFP for strains containing different plasmids encoding the transposase (left) or not (right) in fluctuating environments. The identities of the plasmids are indicated by the three different colors and a different color, grey, indicates the strain that only carries the transposon on the chromosome. Note that without transposition, only two pUC replicates out of five can survive the tetracycline selection after the absence of tetracycline selection for the first five days. Legend is on the top right corner. D. Logarithm fold change of the OD-normalized GFP for both experiments. Left panel is for the loss rate and right panel is for the gain rate. Dark color indicates results of cells with transposase. Light color indicates results of cells without transposase. E. Temporal dynamics of TCN for both experiments. Data is presented in the same arrangement as in panel C. F. Logarithm fold change of the TCN for both experiments. Data is presented in the same arrangement as in panel D. Dark color indicates results of cells with transposase. Light color indicates results of cells without transposase. All statistical tests use the Mann-Whitney U test. p-value annotation legend: ns : 0.05< p <= 1.0; *: 0.01 < p <= 0.05; **: 0.001 < p <= 0.01
Figure 4.
Figure 4.. Plasmid responses amplified transposon responses
A. Experimental design. The kanamycin resistance gene allows for the control of the plasmid dynamic change in fluctuating tetracycline conditions. Kanamycin selection maintains the plasmids with reduced dynamic PCN variations (left); no kanamycin selection allows higher PCN variations (right). B. The growth curves of strains containing under both Kan and Tet selection (left) or under only Tet selection (right). C. Temporal dynamics of PCN for both experiments containing different plasmids under constant Kan selection (left) or not (right) in fluctuating environments. Left panel shows that constant application of kanamycin maintained the PCN in a narrow range. Right panel shows that PCN varied more drastically without kanamycin selection. The identities of the plasmids are indicated by the three different colors. Legend is on the top right corner. D. Logarithm fold change of the PCN for both experiments. Left panel is for the loss rate and right panel is for the gain rate. Dark color indicates results of cells under Kan selection. Light color indicates results of cells not under Kan selection. Cells with Kan selection gained and lost plasmids at slower rates. E. Temporal dynamics of OD-normalized GFP for both experiments containing different plasmids under constant Kan selection (left) or not (right) in fluctuating environments. Data is presented in the same arrangement as in panel C. F. Logarithm fold change of the OD-normalized GFP for both experiments. Data is presented in the same arrangement as in panel D. Dark color indicates results of cells under Kan selection. Light color indicates results of cells not under Kan selection. Cells with Kan selection gained and lost transposons at slower rates. G. Temporal dynamics of TCN for both experiments containing different plasmids under constant Kan selection (left) or not (right) in fluctuating environments. Data is presented in the same arrangement as in panel C. H. Logarithm fold change of the TCN for both experiments. Data is presented in the same arrangement as in panel D. Dark color indicates results of cells under Kan selection. Light color indicates results of cells not under Kan selection. Cells with Kan selection gained and lost transposons at slower rates. All statistical tests use the Mann-Whitney U test. p-value annotation legend: ns : 0.05< p <= 1.0; *: 0.01 < p <= 0.05; **: 0.001 < p <= 0.01
Figure 5.
Figure 5.. Plasmids with higher copy numbers enabled faster transposon response
A. Simulation analysis shows high-copy-number (HCN) plasmids enable faster population response. The simulation assumed higher PCN variations for HCN plasmids. The y-axis is the calculated response speed, and the x-axis is the maximal plasmid copy number. Color gradient also indicates the maximal PCN, with yellow indicating low copy number and purple indicating high copy number. B. Experimental data show HCN plasmids enable faster population response. The y-axis is the calculated response speed, and the x-axis is the maximal plasmid copy number. Top row is transposon loss rate; bottom row is transposon gain rate. The left side shows data of cells with transposon mobility; the right side shows data of cells with no transposon mobility. The arrows indicate the absence of Kan selection; triangles indicate the presence of Kan selection. Panel arrangement is the same as in panel A.

Similar articles

Cited by

References

    1. Panwar S., Kumari S., Verma J., Bakshi S., Narendrakumar L., Paul D., & Das B. (2023). Toxin-linked mobile genetic elements in major enteric bacterial pathogens. Gut Microbiome, 4. 10.1017/gmb.2023.2 - DOI - PMC - PubMed
    1. Rios Miguel A. B., Jetten M. S. M., & Welte C. U. (2020). The role of mobile genetic elements in organic micropollutant degradation during biological wastewater treatment. Water Research X, 9, 100065. 10.1016/j.wroa.2020.100065 - DOI - PMC - PubMed
    1. Kellogg S. T., Chatterjee D. K., & Chakrabarty A. M. (1981). Plasmid-assisted molecular breeding: New technique for enhanced biodegradation of persistent toxic chemicals. Science, 214(4525), 1133–1135. 10.1126/science.7302584 - DOI - PubMed
    1. Roy T., Bandopadhyay A., Paul C., Majumdar S., & Das N. (2022). Role of plasmid in pesticide degradation and metal tolerance in two plant growth-promoting Rhizobacteria bacillus cereus (NCIM 5557) and Bacillus safensis (NCIM 5558). Current Microbiology, 79(4). 10.1007/s00284-022-02793-w - DOI - PubMed
    1. Segura A., Molina L., & Ramos J. L. (2014). Plasmid-mediated tolerance toward environmental pollutants. Microbiology Spectrum, 2(6). 10.1128/microbiolspec.plas-0013-2013 - DOI - PubMed

Publication types

LinkOut - more resources