[Preprint]. 2025 Jun 4:2025.06.02.657512.
doi: 10.1101/2025.06.02.657512.

Single-nucleus epigenomic dysregulation unmasks genetic risk-associated neurodegenerative glia states

Affiliations

Single-nucleus epigenomic dysregulation unmasks genetic risk-associated neurodegenerative glia states

Xia Han et al. bioRxiv. .

Abstract

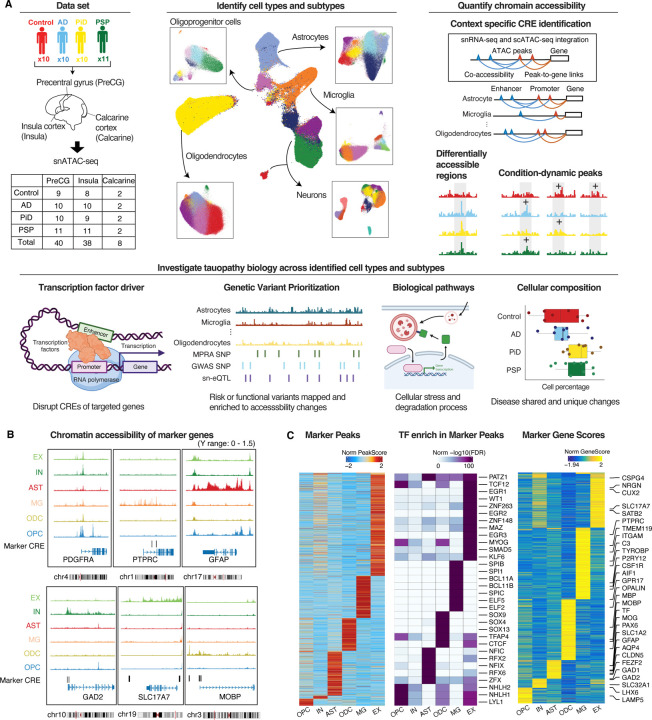
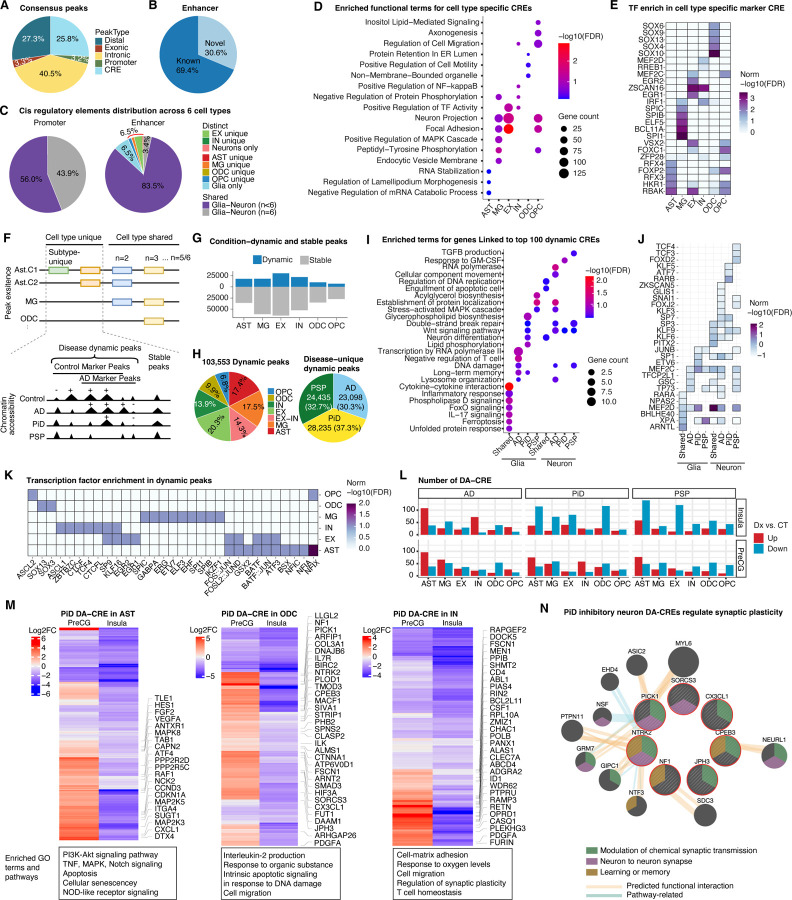
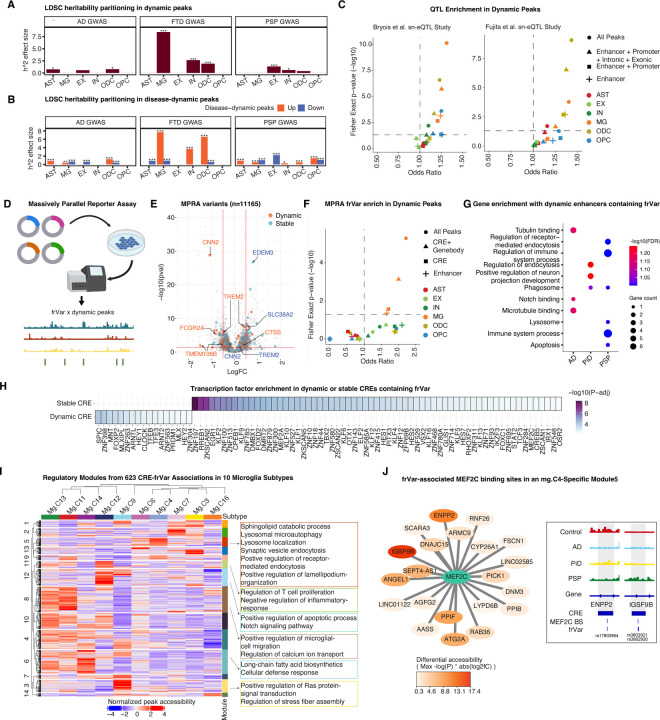
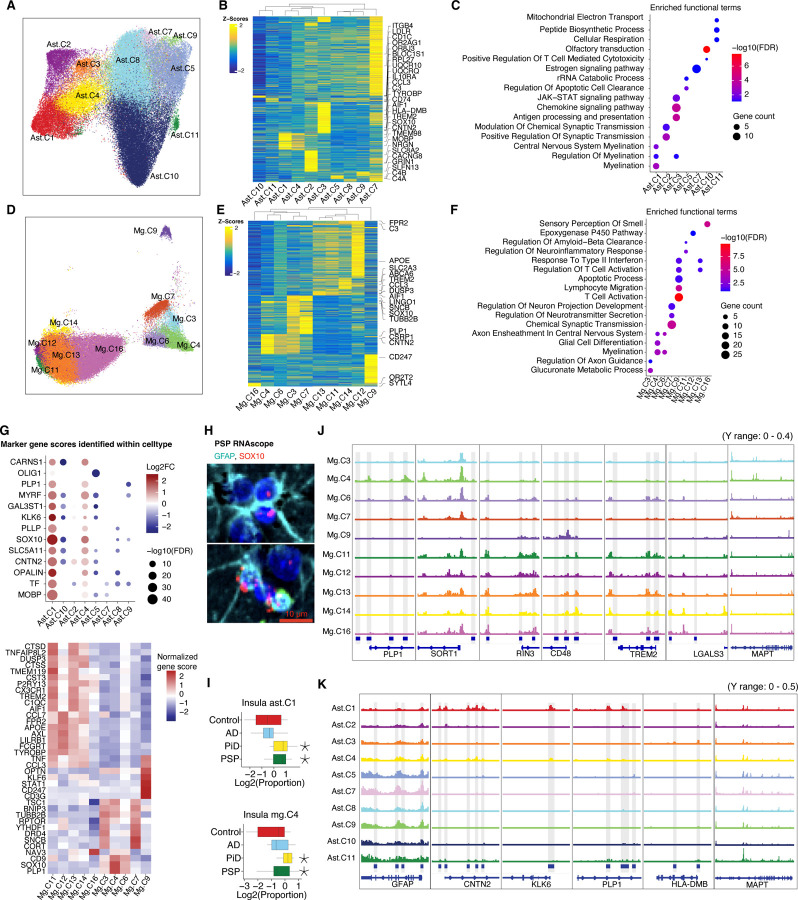
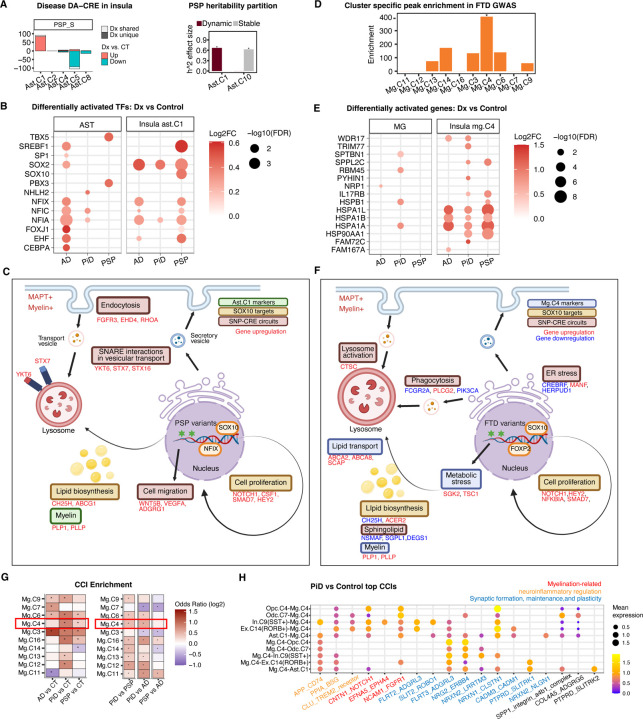
The accumulation of abnormal tau protein selectively affects distinct brain regions and specific populations of neurons and glial cells in tau-related dementias, such as Alzheimer's disease (AD), Pick's disease (PiD), and progressive supranuclear palsy (PSP). Although the three disorders share the feature of tau protein pathology, the regulatory circuitry of non-coding genetic variants underlying risk-associated cell states remains to be elucidated. Using paired single-nucleus profiling of chromatin accessibility and gene expression across AD, PiD, and PSP, we define cell-type-specific cis-regulatory elements (CREs) across six cell types and fifty subclasses. Comparing disease-dynamic CREs across three disorders, we find that glia overrepresent disorder-specific gene regulation related to dynamic cellular response to stress. We show that human genetic variants affecting microglial gene regulation converge into distinct and co-regulated modules affecting specific cellular functions. Moreover, polygenic risk modifiers are maximally co-accessible in disorder-specific glial states, modifying distinct pathways such as sphingomyelin regulation in PiD. Our study informs glial regulators linked to polygenic modifiers of primary tauopathy, introducing modifiable pathways governing resilience for therapeutic consideration.


Conflict of interest statement

Ethics declarations The authors declare no competing interests.

Figures

Fig. 1.
Fig. 1.. Single-nucleus epigenomic landscape of AD, PiD and PSP across brain regions.
(A) Schematic overview of the snATAC-seq analysis workflow. (B) Tracks of chromatin accessibility profiles generated using pseudo-bulk data for each cell type at canonical marker genes. Marker cis-regulatory elements (CREs) of 500 bp are labeled. Visualization and modifications were performed using the UCSC Genome Browser. (C) Heatmaps displaying identified marker peaks (left), marker gene scores (right), and TFs enriched in marker peaks (middle) for each cell type.
Fig. 2.
Fig. 2.. Condition-dynamic and case-control differentially accessible CREs across human brain cell types.
(A) Pie chart showing the distribution of consensus peaks across genomic contexts (CRE, promoter, intronic, exonic, or distal regions). (B) Pie chart depicting identified enhancers, categorized as known or novel. (C) Pie chart illustrating the distribution of promoter peaks (left) and enhancer peaks (right) across cell types. (D) Enriched functional GO terms for genes linked to cell type-specific CRE, analyzed using enrichR . (E) Enrichment of TFs in the top 100 marker CREs uniquely identified in specific cell types, analyzed using MEME . FDRs were standardized within each cell type group. (F) Schematic diagram illustrating the identification of condition-dynamic peaks for each cell type. (G) Bar plot showing the number of dynamic and stable peaks across cell types. (H) Pie charts display the distribution of dynamic peaks across cell types (left) and across diseases (right). (I) Enriched functional GO terms and KEGG pathways of genes associated with the top 100 dynamic CREs, either unique or shared among the three diseases, in glia or neurons. Functional enrichment was performed using enrichR. (J) TF enrichment for dynamic CREs in the same groups as described in (I), analyzed using MEME. (K) TF enrichment in dynamic peaks per cell type, analyzed using MEME. (L) Bar plot showing the number of differentially accessible CREs per disease across cell types, divided into up-regulated and down-regulated peaks. DA-CREs are identified by P<=1e−3 and |Log2FC| >=1.2. (M) Heatmaps of PiD DA-CREs up-regulated in the PreCG and down-regulated in the Insula, shown for astrocytes (left), oligodendrocytes (middle), and inhibitory neurons (right). Enriched GO terms and KEGG pathways of the genes linked to CREs are displayed at the bottom. (N) Gene network of synaptic plasticity-regulating genes involved in the PiD DA-CREs transition across regions in inhibitory neurons. Genes linked to PiD DA-CREs are highlighted within the red circle. The network is constructed using GeneMANIA . DA-CREs: differentially accessible cis-regulatory elements.
Fig. 3.
Fig. 3.. Dynamic accessible regions implicate disease heritability through GWAS, MPRA and sn-eQTL analysis.
(A) Partition of disease heritability in dynamic and stable peaks across cell types for AD, PiD, and PSP GWAS, represented by LDSC standardized effect size τ. (B) Partition of disease heritability in dynamic peaks, stratified by up- and down-regulated peaks for each disease, within each cell type, measured specifically for the corresponding disease. For example, the PSP track depicts LDSC τ for PSP GWAS in PSP up- or down-regulated peaks. (C) Enrichment of sn-eQTLs in dynamic versus stable peaks, tested using Fisher’s exact test. (D) Schematic of the MPRA experiment and integration with dynamic peaks. (E) Volcano plot of MPRA-tested variants, labeled by their overlapping genes’ CREs. (F) Enrichment of MPRA-derived functional regulatory variants (frVars) in dynamic versus stable peaks, tested using Fisher’s exact test. (G) Gene enrichment for dynamic enhancers containing MPRA frVars, analyzed using ShinyGO 0.80. (H) TF enrichment of peaks containing MPRA frVars identified by MEME. (I) Heatmap showing regulatory modules of CREs with frVars across microglial subtypes. Peak accessibility in pseudobulked samples was log2-transformed after depth normalization, and the mean values of subclusters were quantile-normalized. Functional enrichment of CRE-linked genes was analyzed using enrichR. (J) MEF2C-target network in mg.C4-specific module5. MEF2C binding sites overlapping with frVars are enriched in module5 (bottom). Target CREs in this module are linked to genes enriched for neurodegeneration and endocytosis pathways. CREs linked to target genes are colored by their maximal differential accessibility score, calculated as -log(P-value) x |log2FC| from marker peak calling. LDSC τ with FDR thresholds: *< 0.05; ** <0.005; *** < 0.001.
Fig. 4.
Fig. 4.. Diversity and heterogeneity of cellular subtypes in human brain of tauopathies.
(A-C) UMAP embedding of subclusters of astrocytes (A), with a heatmap of gene score matrix labeled by log2fc > 1 for marker gene scores (B) and enriched functional terms associated with these marker genes (C). ASC, astrocytes. (D-F) Similar analyses for microglia subclusters. MG, microglia. (G) Gene signatures of astrocyte subclusters (top) and microglia subclusters (bottom), defined by marker gene scores compared within each respective cell type. (H) RNAscope ISH for SOX10 combined with GFAP IHC in human insular tissue from a PSP patient. Representative images show co-localization of SOX10 mRNA and GFAP in a subset of astrocytes (Scale bar: 10 μm). (I) Boxplots displaying the relative abundance of insula ast.C1 (top) and mg.C4 (bottom) across conditions. Changes in cell composition among disease and control groups are modeled using linear regression computed by Limma, adjusted for age and post-mortem interval. *P<0.05. (J) Example tracks showing marker peaks for genes PLP1, SOT1l in mg.C4; RIN3 and TREM2 in mg.C13 and mg.C6; CD48 in mg.C9 and mg.C6; and LGALS3 in mg.C7 and mg.C14. (K) Example tracks showing marker peaks for genes CNTN2, KLK6, and PLP1 in ast.C1; HLA-DMB in ast.C3; and GFAP in multiple astrocyte subclusters.
Fig. 5.
Fig. 5.. Integrated analysis of accessibility changes, gene activity, GWAS heritability partition, epigenomic stability, and cell-cell interactions identifies disease-associated glia subtypes.
(A) PSP-associated chromatin accessibility changes in astrocytes. Bar plots (left) show the number of differentially accessible CREs in PSP across astrocyte subclusters, categorized by up- and down-regulation. The right panel shows partitioned disease heritability of dynamic peaks in ast.C1 and ast.C10 (right), displaying LDSC standardized effect size τ. FDR *< 0.05; ** <0.005; *** < 0.001. (B) Differentially activated TFs in astrocytes and ast.C1. (C) Schematic of molecular changes and dysregulated pathways driven by PSP GWAS risk variants in PSP ast.C1. Myelin-related astrocytes proliferate in tauopathy, activating SNARE-mediated vesicle trafficking and lysosomal pathway to mitigate lipid stress induced by PSP risk variants. (D) Disease heritability partition in subcluster-specific peaks for FTD GWAS across microglia subtypes. FDR *< 0.05; ** <0.005; *** < 0.001. (E) Differentially activated genes in microglia and mg.C4. (F) Schematic of molecular changes and dysregulated pathways driven by FTD GWAS risk variants in PiD mg.C4. Myelin-related microglia proliferate in tauopathy, activating lysosome-phagocytosis pathways to counteract ER and metabolic stress induced by FTD risk variants. Genes with upregulation are shown in red font, and those with downregulation in blue, based on differential gene scores or genes linked to differentially accessible CREs. (G) Number of cell-cell interactions (CCIs) involving subclusters that are overrepresented in pairwise comparison. (*) FDR < 0.05; chi-square test. (H) Top ligand-receptor pairs mediating interactions between mg.C4 and the represented subclusters in PiD. Values represent the mean expression of ligand-receptor pairs in corresponding cellular pairs.

References

    1. Chung D eun C, Roemer S, Petrucelli L, Dickson DW. Cellular and pathological heterogeneity of primary tauopathies. Molecular Neurodegeneration. 2021;16(1):57. doi: 10.1186/s13024-021-00476-x - DOI - PMC - PubMed
    1. Debnath M, Dey S, Sreenivas N, Pal PK, Yadav R. Genetic and Epigenetic Constructs of Progressive Supranuclear Palsy. Annals of Neurosciences. Published online April 27, 2022:09727531221089396. doi: 10.1177/09727531221089396 - DOI - PMC - PubMed
    1. Moloney CM, Lowe VJ, Murray ME. Visualization of neurofibrillary tangle maturity in Alzheimer’s disease: A clinicopathologic perspective for biomarker research. Alzheimer’s & Dementia. 2021;17(9):1554–1574. doi: 10.1002/alz.12321 - DOI - PMC - PubMed
    1. Valentino RR, Scotton WJ, Roemer SF, et al. MAPT H2 haplotype and risk of Pick’s disease in the Pick’s disease International Consortium: a genetic association study. The Lancet Neurology. 2024;23(5):487–499. doi: 10.1016/S1474-4422(24)00083-8 - DOI - PMC - PubMed
    1. Leveille E, Ross OA, Gan-Or Z. Tau and MAPT genetics in tauopathies and synucleinopathies. Parkinsonism & Related Disorders. 2021;90:142–154. doi: 10.1016/j.parkreldis.2021.09.008 - DOI - PMC - PubMed

Publication types

LinkOut - more resources