[Preprint]. 2025 Jun 3:2025.06.01.657083.
doi: 10.1101/2025.06.01.657083.

BifurcatoR: A Framework for Revealing Clinically Actionable Signal in Variance Masquerading as Noise

Affiliations

BifurcatoR: A Framework for Revealing Clinically Actionable Signal in Variance Masquerading as Noise

Zachary Madaj et al. bioRxiv. .

Abstract

Background: Disease heterogeneity is a persistent challenge in medicine, complicating both research and treatment. Standard analytical pipelines often assume patient populations are homogeneous, overlooking variance patterns that may signal biologically distinct subgroups. Variance heterogeneity (VH)-including skewness, outliers, and multimodal distributions-offers a powerful but underused lens for detecting latent etiological structures relevant to prognosis and therapeutic response.

Methods: A major barrier to VH analysis is the fragmented landscape of available methods, many of which rely on normality assumptions that biological data frequently violate. In addition, existing tools often require programming expertise, and clear guidance on study design considerations-such as sample size and method selection-is lacking. To address these issues, we developed BifurcatoR, an open-source software platform that simplifies the detection, modeling, and interpretation of VH. BifurcatoR integrates simulation-based method evaluation, study design recommendations, and a user-friendly web interface to support VH analysis across a range of data distributions. We benchmarked VH methods through simulation and applied BifurcatoR to two clinical datasets: acute myeloid leukemia (AML) and obesity.

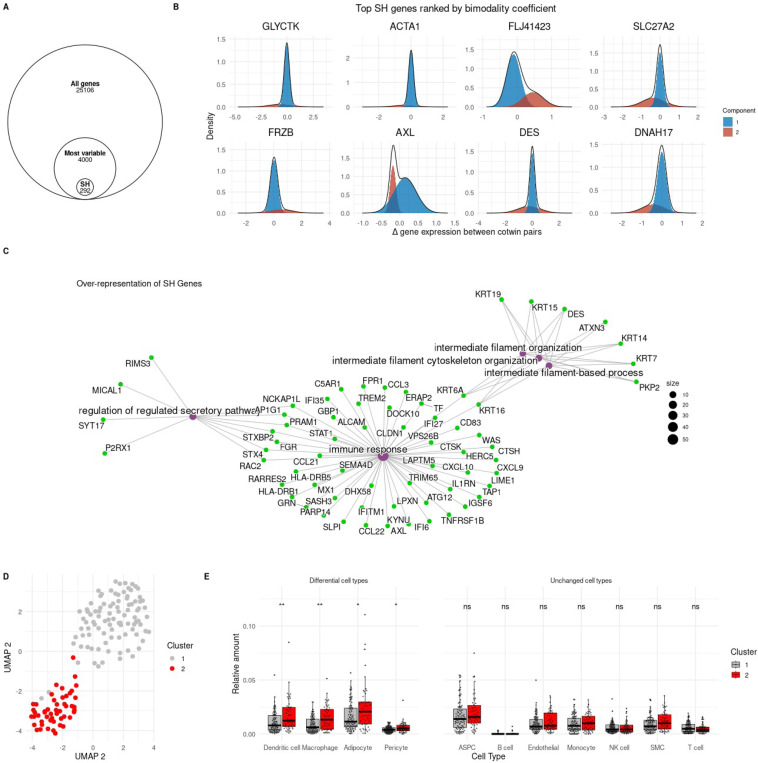
Results: Simulation studies revealed that VH method performance is highly context-specific, varying with distribution shape, mean-variance coupling, and underlying subgroup structure. In AML, BifurcatoR identified two molecularly distinct subgroups with different treatment responses, including an EVI1-high group with significantly poorer prognosis (p < 0.005) among KMT2A-rearranged cases. In a separate study, VH analysis uncovered immunophenotypic subgroups in obesity based on gene-level discordance across monozygotic twin pairs, highlighting latent variation in adipose immune cell composition.

Conclusions: VH is not "noise", biological variation without clinical relevance. Instead, VH is a structured signal that can reveal latent and clinically meaningful subtypes. BifurcatoR offers a practical, accessible framework for incorporating VH into biomedical research, with implications for biomarker discovery, patient stratification, and precision medicine.

Keywords: cancer; epigenetics; heterogeneity; obesity; phenotypic noise; twins; variability.


Figures

Figure 1.
Figure 1.. Workflow for variance heterogeneity and bimodality study planning and analysis with BifurcatoR.
1. Upload either a full dataset for analysis or pilot data 2. Perform exploratory data analysis to better understand shape, scale, and modality of data. 3. Either: i. Run desired tests of significance on a full dataset for final inference ii. Gather relevant parameters from 2. for use in a respective power analysis 1. Module 1: comparing two unimodal groups 2. Module 2: testing for bimodality 3. Module 3: comparing two bimodal groups
Figure 2.
Figure 2.. Real data analysis of within-group variation in acute myeloid leukemia.
A. Kaplan-Meier curves with 95% confidence bands for fusion partners appearing in n ≥ 5 patients. B. Densities and histogram plot of overall survival generated with mixR, assuming a Weibull distribution, and revealing strong evidence for bimodality (p < 0.001). C. Densities and histogram plot of EVI1 gene expression (log2) generated with mixR using the Gaussian family, which shows strong evidence of bimodality (p < 0.001). D. Kaplan-Meier curves with 95% confidence bands for splitting the cohort into ‘low’ and ‘high’ EVI1 expression using mixR component probabilities (classification was based on the most probable mode). E. Mosaic plot of the classification matrix of EVI1 high vs low expression and long- vs short-term survival where survival was based on mixR component probabilities from B. Chi-square test on this classification table revealed significant evidence against independence between survival groups and EVI1 expression groups (p = 0.029).
Figure 3.
Figure 3.. Analysis of ‘Structured Heterogeneity’ in gene expression profiles stratifies humans into two distinct metabolic state clusters with differing adipose tissue immune cell composition signatures.
A. The TwinsUK data has expression measured on 25106 genes. Structured heterogeneity was investigated on the 4000 most variable genes based the gene expression discordance between cotwin pairs where 292 has significant evidence of being SH after BH multiple testing corrections. B. The densities and histograms of the top eight SH genes ranked by bimodality coefficients generated with mixR and a Gaussian family. C. Over-representation network containing gene ontologies (purple) significantly enriched with SH genes (shown in green) (FDR < 0.05). Size is the number of genes found in a given pathway. The 4000 most variable genes were used as the “background universe” D. UMAP of in silico estimates of cell-type proportions colored by clusters identified using Seurat E. Boxplots of each twin’s cell-type proportion split by Seurat cluster. Wilcoxon tests were used to determine if cell-type proportions differed between clusters. ‘*’ p < 0.05; “**’ p < 0.01

References

    1. Kosorok MR, Laber EB. Precision Medicine. Annu Rev Stat Appl 2019;6:263–286. DOI: 10.1146/annurev-statistics-030718-105251. - DOI - PMC - PubMed
    1. Luo J, Wu M, Gopukumar D, Zhao Y. Big Data Application in Biomedical Research and Health Care: A Literature Review. Biomed Inform Insights 2016;8:1–10. DOI: 10.4137/BII.S31559. - DOI - PMC - PubMed
    1. Mallappallil M, Sabu J, Gruessner A, Salifu M. A review of big data and medical research. SAGE Open Med 2020;8:2050312120934839. DOI: 10.1177/2050312120934839. - DOI - PMC - PubMed
    1. Cremin CJ, Dash S, Huang X. Big data: Historic advances and emerging trends in biomedical research. Current Research in Biotechnology 2022;4:138–151. DOI: 10.1016/j.crbiot.2022.02.004. - DOI
    1. Naithani N, Atal AT, Tilak T, Vasudevan B, Misra P, Sinha S. Precision medicine: Uses and challenges. Med J Armed Forces India 2021;77(3):258–265. DOI: 10.1016/j.mjafi.2021.06.020. - DOI - PMC - PubMed

Publication types

LinkOut - more resources