[Preprint]. 2025 Jun 6:2025.06.02.657499.
doi: 10.1101/2025.06.02.657499.

OrganoidChip+: a Microfluidic Platform for Culturing, Staining, Immobilization, and High-Content Imaging of Adult Stem Cell-Derived Organoids

Affiliations

OrganoidChip+: a Microfluidic Platform for Culturing, Staining, Immobilization, and High-Content Imaging of Adult Stem Cell-Derived Organoids

Khashayar Moshksayan et al. bioRxiv. .

Update in

Abstract

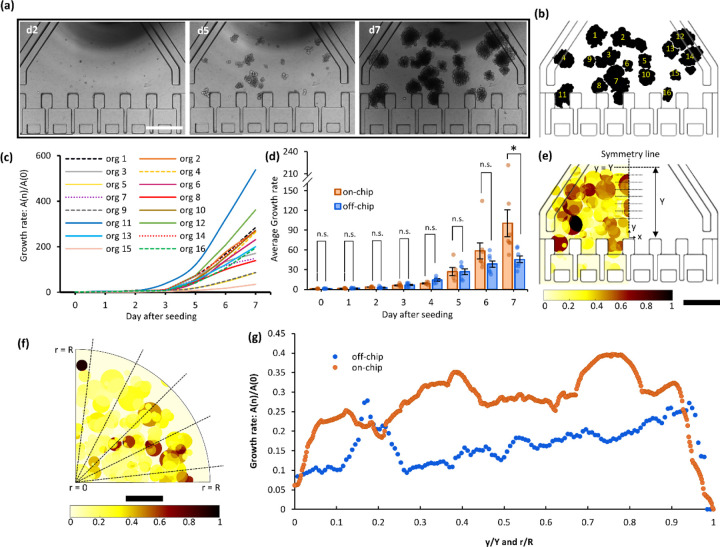
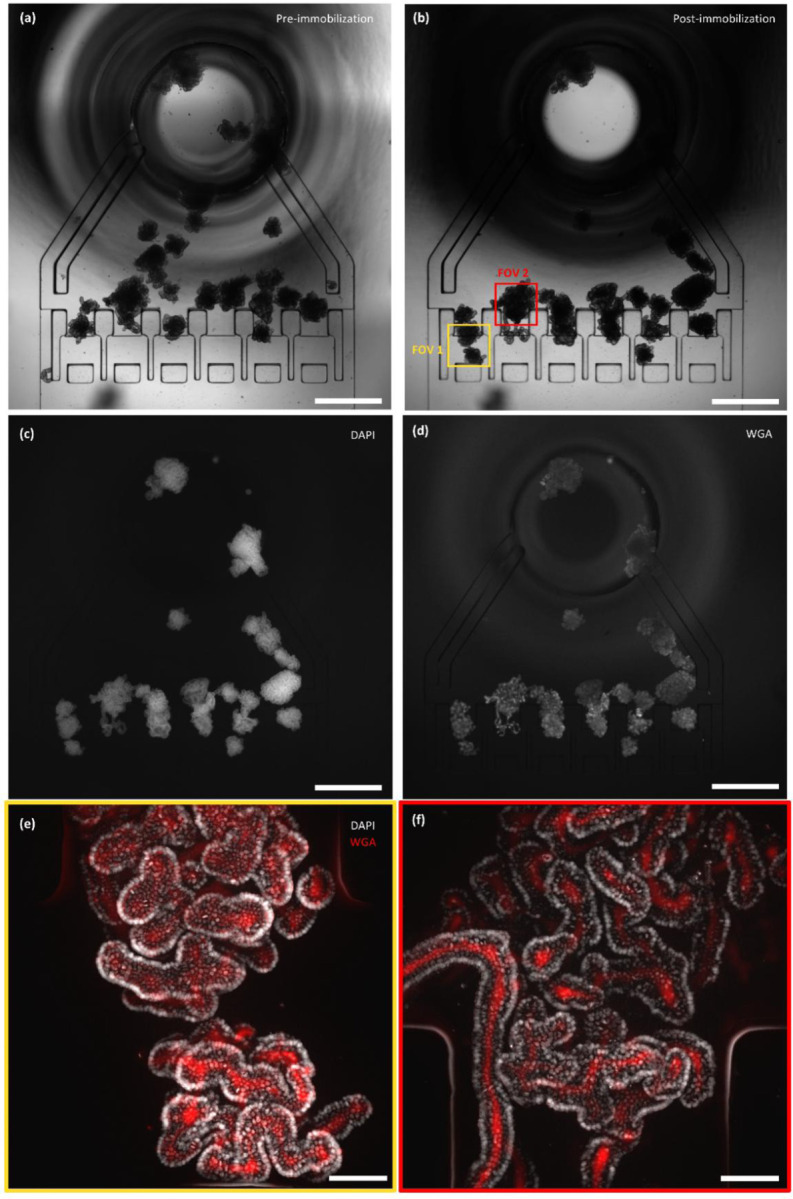
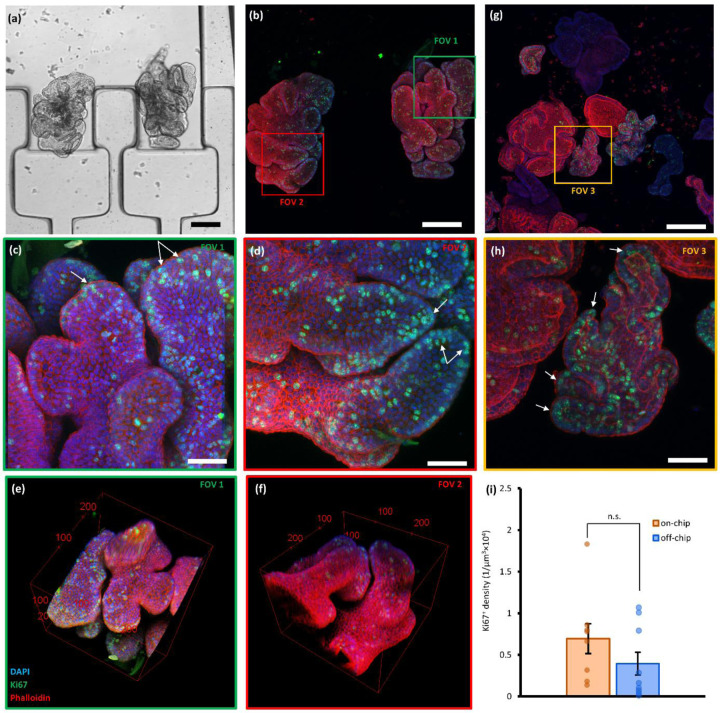
High-content imaging (HCI) and analysis are the keys for advancing our understanding of the science behind organogenesis. To this end, culturing adult stem cell-derived organoids (ASOs) in a platform that also enables live imaging, staining, immobilization, and fast high-resolution imaging is crucial. However, existing platforms only partially satisfy these requirements. In this study, we present the OrganoidChip+, an all-in-one microfluidic device designed to integrate both culturing and HCI of ASOs all within one platform. We previously developed the OrganoidChip as a robust imaging tool. Now, the OrganoidChip+ incorporates several additional features for culturing organoids in addition to fluorescence staining and imaging without the need for sample transfer. The organoids grown within a culture chamber are stained and then transferred to immobilization chambers for blur-free, high-resolution imaging at predetermined locations. We cultured adult stem cell-derived intestinal organoids in the chip for 7 days and tracked growth rates of each organoid using intermittent brightfield images, followed by multiple image-based assays, including viability assay using widefield fluorescence imaging, a redox ratio assay using label-free, two-color, two-photon microscopy, and immunofluorescence assays using confocal microscopy. These assays serve as proof-of-concept to showcase the chip's capabilities in HCI of ASOs. Organoids cultured in the chip exhibited superior average growth rates over those in traditional Matrigel dome cultures, off-chip. Viability and redox ratio measurements of on-chip organoids were comparable or slightly better than their off-chip counterparts. Confocal imaging further confirmed that the OrganoidChip+ supports robust organoid culture while enabling detailed, high-resolution analysis. This all-in-one platform holds great potential for advancing ASO-based research, offering a scalable and cost-effective solution for HCI and analysis in organogenesis, drug screening, and disease modeling.


Conflict of interest statement

Conflict of interest A.B., K.M., S.M., E.H., and A.H. are listed as inventors on a pending U.S. patent application (PCT/US24/13330) directly related to the platform described in this work, which has been licensed to vivoVerse, LLC. Additionally, A.B., S.M., and E.H. hold equity in vivoVerse, LLC. These disclosures have been reviewed and managed according to institutional policies addressing potential conflicts of interest in research. K.A. is a co-founder of LifEngine Animal Health and 3D Health Solutions and serves as a consultant for Ceva Animal Health, Bioiberica, LifeDiagnostics, Antech Diagnostics, Deerland Probiotics, Christian Hansen Probiotics, Purina, and Mars. J.P.M. is a co-founder of LifEngine Animal Health (LEAH) and 3D Health Solutions and serves as a consultant for Ceva Animal Health, Ethos Animal Health, LifEngine Animal Health and Boehringer Ingelheim. C.Z. is the Director of Research and Product Development at 3D Health Solutions.

Figures

Figure 1:
Figure 1:. OrganoidChip+’s dimensions and principle of work.
(a) The chip schematic depicting its height dimensions and various compartments such as the inlet, perfusion channel (PC), culture chamber (CC), trapping areas (TAs) consisting of staging chambers (SCs) and immobilization chambers (ICs), filter channels (FCs), exit chamber (EC), and serpentine exit channel. The serpentine exit channel with a length of 43.5 mm and a width of 215 µm generates a hydrodynamic resistance of 3 × 10¹² (N.s/m5) to avoid high flow rates and shear stress inside the chip. (b) Various steps for cell seeding (i), organoid culture (ii), and immobilization (iii) in the chip. (i) For seeding, the Luer stub is inserted into the culture chamber, the cell suspension is dispensed with a rotating movement to fill the entire culture chamber. (ii) Organoids grow efficiently while accessing nutrients from all direction surrounding the culture chamber. (iii) Matrigel is digested, and organoids are pushed into the TAs for immobilization while some organoids are natively immobilized by adhering to the glass in the culture chamber. (c) Side view of the same steps depicted in (b). The organoids in the culture chamber are imaged using brightfield microscopy every day to track their growth. After 7 days of culturing, Matrigel is digested to enable organoid immobilization within TAs. After immobilization, organoids can be fluorescently labelled and imaged at high-resolution on the chip. Scale bars represent 1 mm in (a-b) and 400 µm in (c).
Figure 2:
Figure 2:. The growth rate of organoids cultured off- and on-chip.
(a) Brightfield images on Days 2 (d2), 5 (d5), and 7 (d7) after seeding. (b) Segmented binary image corresponding to Day 7 of (a). (c) Organoids’ areas as calculated from segmented images in (b) and normalized by their Day 0 values. (d) Organoid growth rates between Days 0 to 7 for the off- and on-chip experiments. Each dot represents the mean growth rate of all organoids in a single experiment and the bars depict the average growth rates across 7 experiments. Each experiment consists of one chip and at least one quarter of a Matrigel dome. Error bars represent standard deviations. Heatmaps (e) and (f) show the organoids as circles with their equivalent radius for 7 experiments in the culture chamber and the dome, respectively. Circles are color-coded to depict the normalized growth rates. (g) Heatmap values on the dotted lines in (e) and (f) were averaged and plotted along y-direction in (e) and radially in (f). Not all lines are displayed in (f), as a total of 91 lines were used, with angles relative to the horizontal edge of the quarter ranging from 0˚ to 90˚ in 1-degree increments. Scale bars in (a) and (e-f) represent 1 mm.
Figure 3:
Figure 3:. Widefield imaging of fluorescently labelled organoids grown in the OrganoidChip+.
(a-b) Images of on-chip organoids on Day 7, (a) before digesting the Matrigel and (b) after immobilization. (c) Images of organoids that are stained with Calcein AM (green) and EthD-1 (red) and imaged with a 0.16 NA, 4× objective. (d-h) Images of organoids that are cultured and stained on the same chip with Hoechst (gray) and EthD-1 (red) to show nuclei of all cells and dead cells, respectively. Image in (d) corresponds to the same chip shown in (a-b), indicating the FOVs imaged using higher NA objectives in (e-h). Image in (e) is captured with 0.3 NA, 10× objective, and those in (f-h) are captured using 0.75 NA, 20× objective. The high-resolution imaging was able to resolve single nuclei of the live and dead cells in organoids. (i) Depicts viability of organoids across three experiments. Each experiment consists of two chips and two wells. Each dot represents the viability of one organoid. The viability values are not statistically different except for the second experiment (two-way t-test). The error bars show standard deviations. Scale bars represent 400 µm in (a-d) and 100 µm in (e-h).
Figure 4:
Figure 4:. Redox ratio imaging using label-free, two-color, two-photon microscopy.
Three organoid groups were treated with 0.1% DMSO (vehicle control), and 0.3 µM and 2 µM Dox concentrations on Day 5 after seeding and incubated for 48 hours prior to imaging. Each treatment condition was conducted both off-chip and on-chip. (a) Sample images from off- and on-chip organoids showing the NADH, FAD, and redox ratio (NADH/FAD) extracted from the autofluorescence images collected at the excitation wavelengths of 745 nm (exciting both NADH and FAD) and 860 nm (exciting only FAD). (b) Magnified view of NADH images captured from on-chip vehicle control and 0.3 µM Dox-treated organoids. Images show the organoid lumens with orange arrows and epithelial cell linings with white arrows. (c) Shows the normalized redox ratio values where each data point corresponds to an organoid and bars denote the mean values. Each Dox-treated group was repeated three times with the corresponding vehicle DMSO control (n = 2 organoids per group). Error bars represent standard error of the mean (SEM). Scare bars represent 100 µm in (a) and 30 µm in (b).
Figure 5:
Figure 5:. High-resolution images of organoids cultured, immobilized, and stained with DAPI and WGA, all performed within the same chip.
(a-b) Brightfield images of the chip with organoids stained with WGA and DAPI on-chip, before and after immobilization, respectively. (c-d) Widefield fluorescence images captured with a 0.16 NA, 4× objective from DAPI and WGA, respectively. (e-f) High-resolution images captured with a 0.75 NA, 20× objective from organoids in FOVs 1 and 2 shown in (b). Images depict nuclei (DAPI, gray) and the intestinal lumen (WGA, red). Scale bars in (a-d) indicate 1 mm and those in (e-f) indicate 100 µm.
Figure 6:
Figure 6:. Fluorescence confocal images of organoids captured following growth and immunofluorescence (ChgA – green), DAPI (blue), and phalloidin (red) staining off- and on-chip.
(a-b) Brightfield and widefield fluorescence images of organoids immobilized in the SCs or ICs. (c-d) FOVs 1 and 2 were recaptured using confocal microscopy (0.3 NA, 10×). (e-f) Confocal images (0.6 NA, 40×) of FOVs 3 and 4 shown in (c) and (d). (g) Compares the density of ChgA+ cells between off- and on-chip organoids with no statistically significant differences. n = 7 FOVs per condition, captured with a 0.6 NA, 40× objective (two-way t-test, p-value = 0.22). (h) Image from off-chip organoids (0.3 NA, 10×). (i) FOV 5 was recaptured using a 0.6 NA, 40× objective. White arrows point out the ChgA+ enteroendocrine cells. Scale bars represent 200 µm in (a-d) and (h), and 50 µm in (e-f) and (i).
Figure 7:
Figure 7:. Fluorescence confocal images of organoids captured following growth and immunofluorescence (Ki67 – green), DAPI (blue), and phalloidin (red) staining off- and on-chip.
(a) Brightfield (0.16 NA, 4×) and (b) confocal fluorescence images (0.3 NA, 10×) of organoids, stained and immobilized in TAs in the chip following their 7-day-long culturing in the chip. (c) FOV 1 and (d) FOV 2, were recaptured using a 0.6 NA, 40× objective. (e-f) 3D reconstruction of FOVs 1 and 2 using z-images captured with a step size of 3 µm. The bounding boxes serve as scale bars with dimensions in microns. (g) Image from off-chip organoids (0.3 NA, 10×). (h) FOV 3 was recaptured using a 0.6 NA, 40× objective. White arrows point out the Ki67+ proliferative cells located at the crypts. (i) Plot of Ki67+ cells densities observed both off- and on-chip organoids, showing no statistically significant differences. n= 8 FOVs per condition, captured with a 0.6 NA, 40× objective (two-way t-test, p-value = 0.52). Scale bars represent 200 µm in (a), (b), and (g), and 50 µm in (c), (d), and (h).

References

    1. Schuster B. et al. Automated microfluidic platform for dynamic and combinatorial drug screening of tumor organoids. Nature Communications 11, 5271, doi: 10.1038/s41467-020-19058-4 (2020). - DOI - PMC - PubMed
    1. Hu Y. et al. Lung cancer organoids analyzed on microwell arrays predict drug responses of patients within a week. Nature Communications 12, 2581, doi: 10.1038/s41467-021-22676-1 (2021). - DOI - PMC - PubMed
    1. Lohasz C., Frey O., Bonanini F., Renggli K. C Hierlemann, A. Tubing-Free Microfluidic Microtissue Culture System Featuring Gradual, in vivo- Like Substance Exposure Profiles. Frontiers in Bioengineering and Biotechnology 7, doi: 10.3389/fbioe.2019.00072 (2019). - DOI - PMC - PubMed
    1. Park S. E. et al. Geometric engineering of organoid culture for enhanced organogenesis in a dish. Nature Methods 1G, 1449–1460, doi: 10.1038/s41592-022-01643-8 (2022). - DOI - PMC - PubMed
    1. Geyer M. et al. A microfluidic-based PDAC organoid system reveals the impact of hypoxia in response to treatment. Cell Death Discovery G, 20, doi: 10.1038/s41420-023-01334-z (2023). - DOI - PMC - PubMed

Publication types