[Preprint]. 2025 Jun 5:2025.06.02.656433.
doi: 10.1101/2025.06.02.656433.

A spatial transcriptomic atlas of acute neonatal lung injury across development and disease severity

Affiliations

A spatial transcriptomic atlas of acute neonatal lung injury across development and disease severity

Saahithi Mallapragada et al. bioRxiv. .

Update in

Abstract

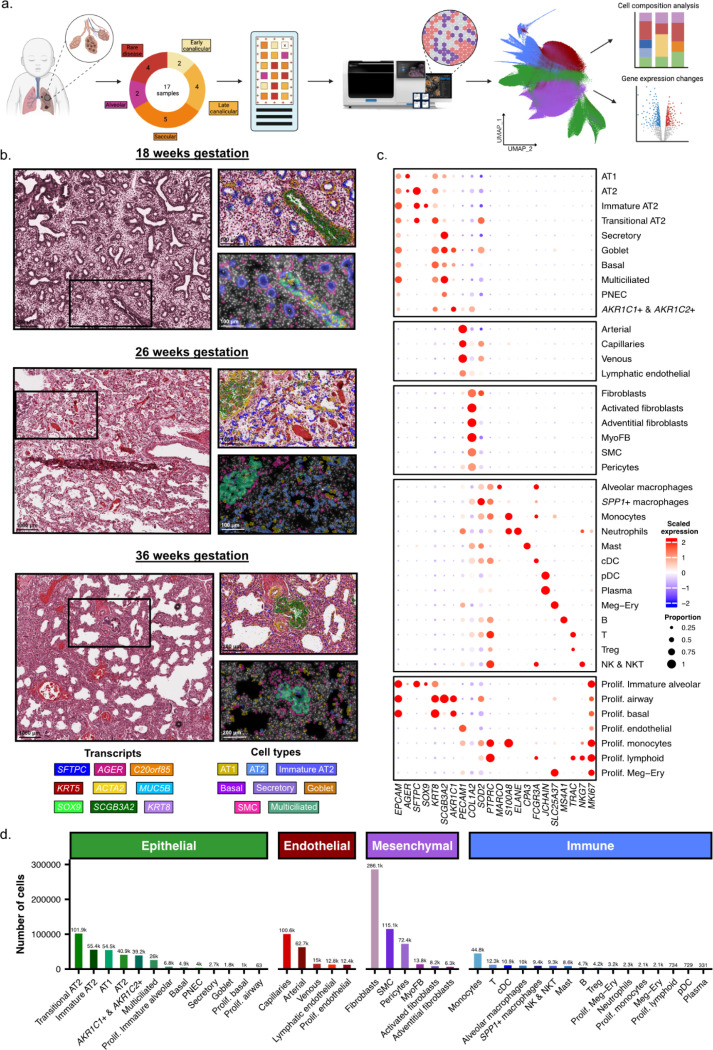
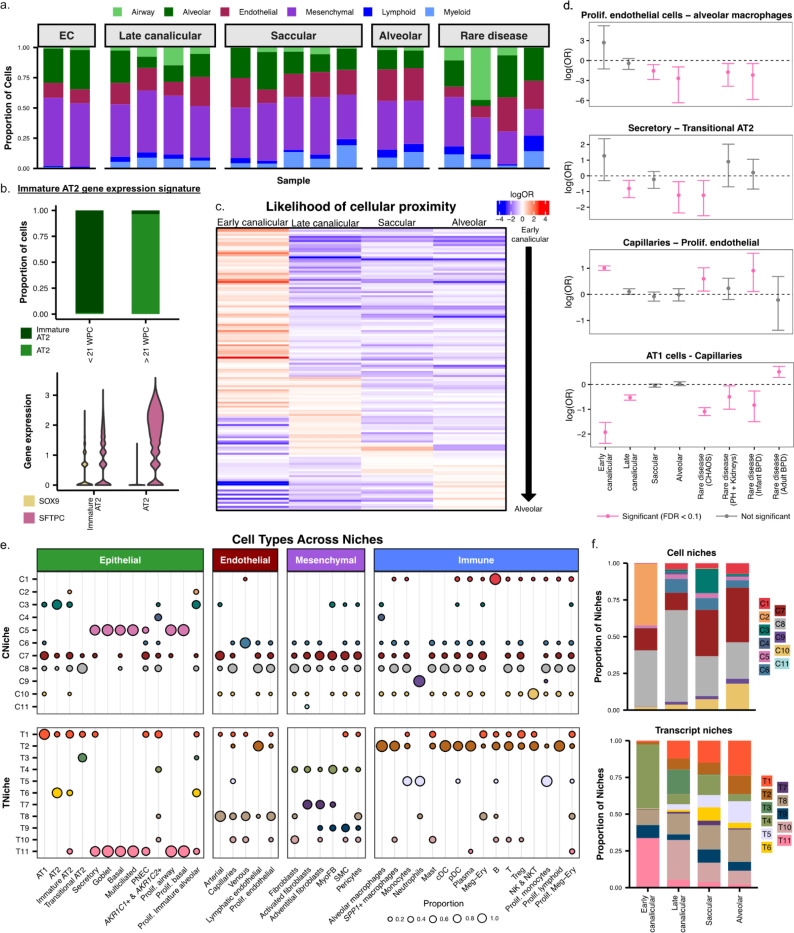
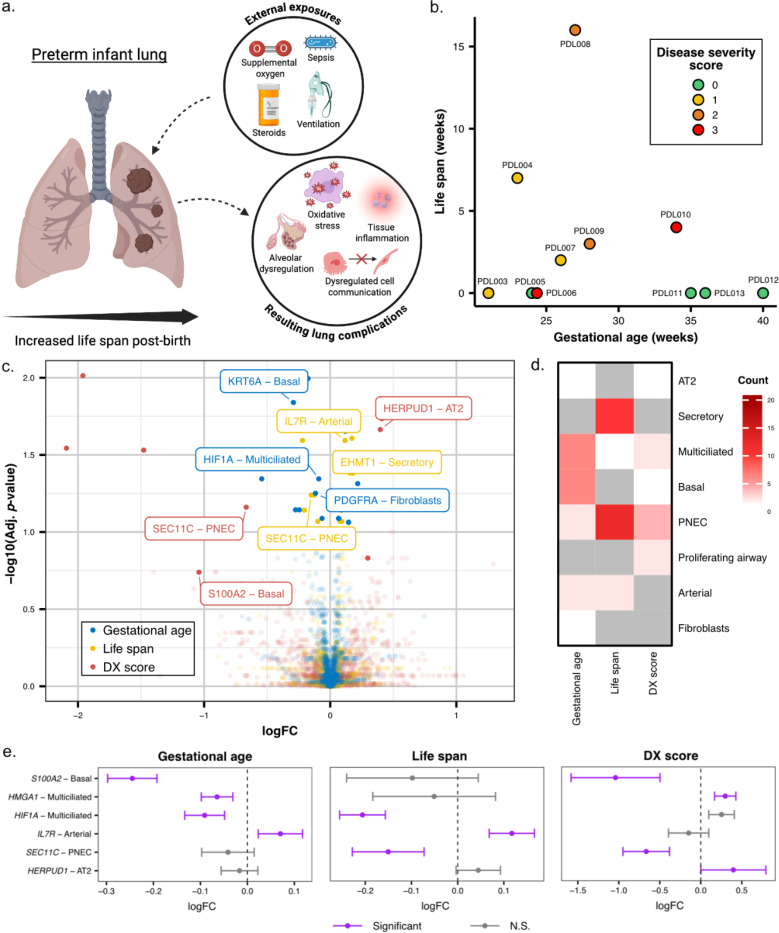
A molecular understanding of lung organogenesis requires delineation of the timing and regulation of the cellular transitions that ultimately form and support a surface capable of gas exchange. While the advent of single-cell transcriptomics has allowed for the discovery and identification of transcriptionally distinct cell populations present during lung development, the spatiotemporal dynamics of these transcriptional shifts remain undefined. With imaging-based spatial transcriptomics, we analyzed the gene expression patterns in 17 human infant lungs at varying stages of development and injury, creating a spatial transcriptomic atlas of ~1.2 million cells. We applied computational clustering approaches to identify shared molecular patterns among this cohort, informing how tissue architecture and molecular spatial relationships are coordinated during development and disrupted in disease. Recognizing that all preterm birth represents an injury to the developing lung, we created a simplified classification scheme that relies upon the routinely collected objective measures of gestational age and life span. Within this framework, we have identified cell type patterns across gestational age and life span variables that would likely be overlooked when using the conventional "disease vs. control" binary comparison. Together, these data represent an open resource for the lung research community, supporting discovery-based inquiry and identification of targetable molecular mechanisms in both normal and arrested human lung development.


Figures

Figure 1.
Figure 1.. Spatial transcriptomic analysis of human infant lung tissue reveals distinct cell populations spatially localized to histological structures.
a) Schematic representation of the study design. b) H&E images of infant lung tissue within this study at different developmental and gestational ages, with transcripts overlayed (top inset) colored by hallmark gene transcript, and a Xenium explorer image (bottom inset) colored by cell type. c) Dotplot heatmap demonstrating representative hallmark genes used to annotate all 40 cell types, with the diameter of each circle indicating the relative proportion of cells expressing the transcript and the intensity of color representing the abundance of transcripts. d) A bar plot demonstrating the frequency of each cell type across the entire dataset, split by epithelial, endothelial, mesenchymal, and immune cell lineages.
Figure 2.
Figure 2.. Analysis of the cellular and molecular neighborhoods and “niches” identifies a unique pattern of cell-cell interactions associated with developmental stage.
a) A stacked bar plot highlighting the proportion of each sublineage across every sample in this cohort. Samples are grouped by developmental stage and rare disease. Rare diseases included ( in this order): CHAOS syndrome, pulmonary hypoplasia + dysplastic kidneys, ARB fetopathy-induced BPD, and the 30-year explant with BPD. b) A barchart and violin plot demonstrating shifts in cell type proportion between AT2 and immature AT2 (top panel) and the increase of SOX9 and decrease of SFTPC expression in immature AT2 cells (bottom panel). c) A heatmap of log odds ratios (logOR) quantifying proximity likelihood between cell types across developmental windows. Each row represents a cell-cell interaction probability with red indicating higher likelihood of two cells being in close proximity. Results can be found in Supplemental Tab. S4. Early canalicular to alveolar stages are ordered left to right. d) Lollipop plots showing logOR and confidence intervals for selected cell type - cell type proximity across each developmental stage and rare disease samples. In each cell type pair, the cell type listed first is considered the starting cell in the analysis; e.g., for the Secretory – Transitional AT2 pair, logOR and confidence intervals reflect the enrichment/depletion of Transitional AT2 cells as the single nearest neighbors of Secretory cells (see Methods). Pink error bars indicate statistically significant results (FDR < 0.1); gray indicates non-significance. e) The distribution of cell types across defined niches. Dot plot shows the presence and relative abundance of specific cell types within both cell-based and transcript-based niches (top: “CNiche”, bottom: “TNiche”), stratified by major lineage (epithelial, endothelial, mesenchymal, immune). Dot size reflects the proportion of cells within that cell type & niche. f) Niche proportion across developmental stage. Stacked bar plots show the composition of cell niches (top) and transcript niches (bottom) across gestation. For both CNiches and TNiches, proportions reflect the number of cells, not transcripts, assigned to a given niche.
Figure 3.
Figure 3.. The impact of gestational age, life span, and disease severity on lung biology in preterm infants.
a) An overview of how gestational age and environmental factors can alter lung development. The graphic illustrates how supplemental oxygen, ventilation, sepsis, and other external factors (often used when an infant is born early) can contribute to alveolar dysregulation, oxidative stress, and tissue inflammation, ultimately disrupting cell-cell communication and overall lung development in preterm infants. b) A scatterplot showing each sample’s gestational age (x-axis) and postnatal life span (y-axis), with points colored by disease severity (DX) score (0–3). c) Volcano plot of gene expression associated with gestational age, life span, and disease severity score. Log fold change (logFC) plotted against FDR for genes significantly associated with at least one variable. Labeled genes are color-coded by the associated condition: gestational age (blue), life span (yellow), and disease severity score (red). d) Gene - cell type associations between gestational age, life span, and disease severity. The heatmap displays the number of significantly associated genes per cell type for each variable. Higher counts (darker red) indicate a higher number of significantly differentially expressed genes in that cell type. e) Significant genes that are upregulated in specific cell types between gestational age, life span, and disease severity score. Lollipop plots show logFC and confidence intervals for select gene - cell type pairs across gestational age, life span, and disease severity. Purple indicates significant associations (two-level FDR cutoff, see Methods); gray indicates non-significant (N.S.).

Similar articles

References

    1. Nikolić MZ, Sun D, Rawlins EL. Human lung development: recent progress and new challenges. Development. 2018. Aug 15;145(16):dev163485. - PMC - PubMed
    1. Branchfield K, Li R, Lungova V, Verheyden JM, McCulley D, Sun X. A three-dimensional study of alveologenesis in mouse lung. Dev Biol. 2016. Jan 1;409(2):429. - PMC - PubMed
    1. Mund SI, Stampanoni M, Schittny JC. Developmental alveolarization of the mouse lung. Dev Dyn Off Publ Am Assoc Anat. 2008. Aug;237(8):2108–16. - PubMed
    1. Pan H, Deutsch GH, Wert SE, Ontology Subcommittee, NHLBI Molecular Atlas of Lung Development Program Consortium. Comprehensive anatomic ontologies for lung development: A comparison of alveolar formation and maturation within mouse and human lung. J Biomed Semant. 2019. Oct 24;10(1):18. - PMC - PubMed
    1. Herriges M, Morrisey EE. Lung development: orchestrating the generation and regeneration of a complex organ. Development. 2014/01/23 ed. 2014. Feb;141(3):502–13. - PMC - PubMed

Publication types

LinkOut - more resources