[Preprint]. 2025 Jun 2:2025.06.02.25328773.
doi: 10.1101/2025.06.02.25328773.

A Biological-Systems-Based Analyses Using Proteomic and Metabolic Network Inference Reveals Mechanistic Insights into Hepatic Lipid Accumulation: An IMI-DIRECT Study

Natalie N Atabaki  1   2   3 Daniel E Coral  2 Hugo Pomares-Millan  2   4 Kieran Smith  3 Harry H Behjat  5 Robert W Koivula  3 Andrea Tura  6 Hamish Miller  3   7 Katherine Pinnick  3 Leandro Agudelo  8   9 Kristine H Allin  1 Andrew A Brown  10 Elizaveta Chabanova  11 Piotr J Chmura  12 Ulrik P Jacobsen  12 Adem Y Dawed  10 Petra J M Elders  13 Juan J Fernandez-Tajes  2 Ian M Forgie  10 Mark Haid  14 Tue H Hansen  1   15 Elizaveta L Hansen  11 Angus G Jones  16 Tarja Kokkola  17 Sebastian Kalamajski  2 Anubha Mahajan  18 Timothy J McDonald  19 Donna McEvoy  20 Mirthe Muilwijk  21   22 Konstantinos D Tsirigos  23 Jagadish Vangipurapu  17   24 Sabine van Oort  13 Henrik Vestergaard  1   25 Jerzy Adamski  26   27   28 Joline W Beulens  21 Søren Brunak  12 Emmanouil T Dermitzakis  29 Giuseppe N Giordano  2 Ramneek Gupta  1 Torben Hansen  1 Leen T Hart  22   30   31   32 Andrew T Hattersley  16 Leanne Hodson  3 Markku Laakso  17 Ruth J F Loos  1   33   34   35 Jordi Merino  1 Mattias Ohlsson  36 Oluf Pedersen  37 Martin Ridderstråle  38 Hartmut Ruetten  39 Femke Rutters  21   22 Jochen M Schwenk  40 Jeremy Tomlinson  3 Mark Walker  41 Hanieh Yaghootkar  42 Fredrik Karpe  3 Mark I McCarthy  43 Elizabeth Louise Thomas  44 Jimmy D Bell  44 Andrea Mari  6 Imre Pavo  45 Ewan R Pearson  10 Ana Viñuela  10 Paul W Franks  2   46
Affiliations

A Biological-Systems-Based Analyses Using Proteomic and Metabolic Network Inference Reveals Mechanistic Insights into Hepatic Lipid Accumulation: An IMI-DIRECT Study

Natalie N Atabaki et al. medRxiv. .

Abstract

Objective: To delineate organ-specific and systemic drivers of metabolic dysfunction-associated steatotic liver disease (MASLD), we applied integrative causal inference across clinical, imaging, and proteomic domains in individuals with and without type 2 diabetes (T2D).

Research design and methods: We used Bayesian network analyses to quantify causal pathways linking adipose distribution, glycemia, and insulin dynamics with fatty liver using data from the IMI-DIRECT prospective cohort study. Measurements were made of glucose and insulin dynamics (using frequently-sampled metabolic challenge tests), MRI-derived abdominal and liver fat content, serological biomarkers, and Olink plasma proteomics from 331 adults with new-onset T2D and 964 adults free from diabetes at enrolment. The common protocols used in these two cohorts provided the opportunity for replication analyses to be performed. When the direction of the effect could not be determined with high probability through Bayesian networks, complementary two-sample Mendelian randomization (MR) was employed.

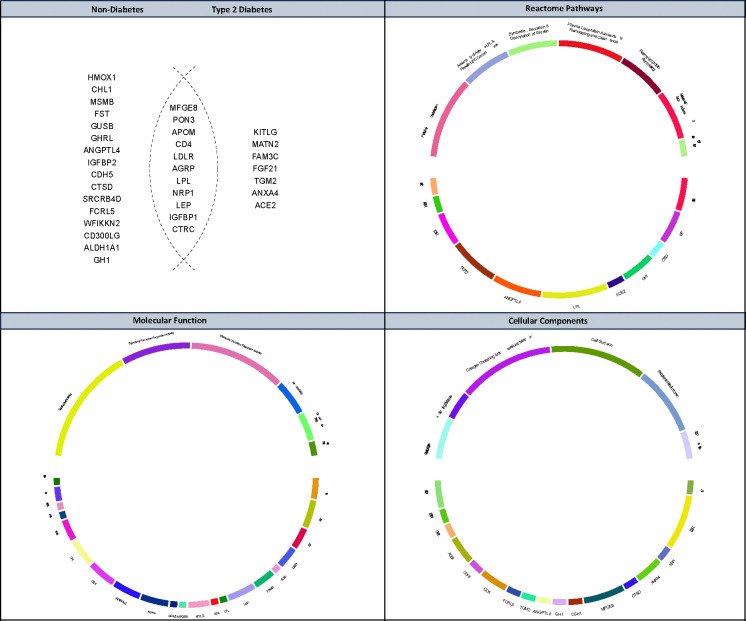
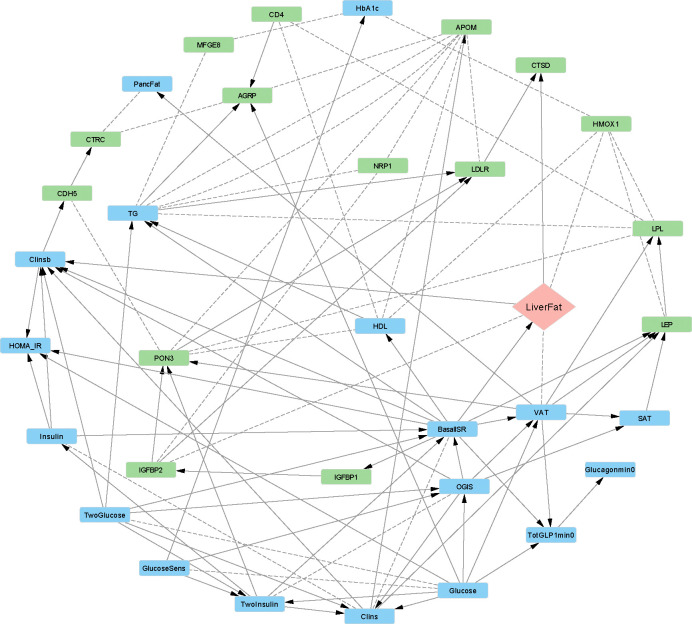
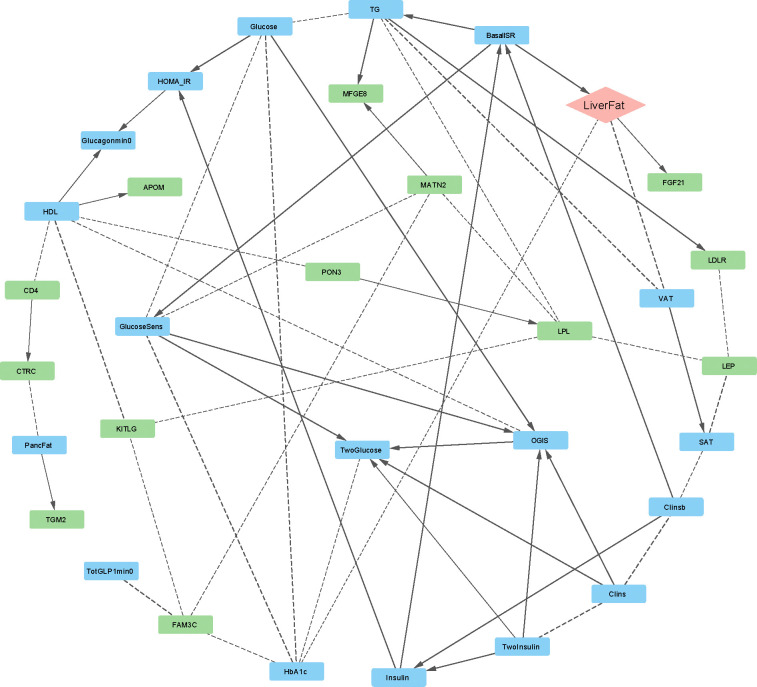
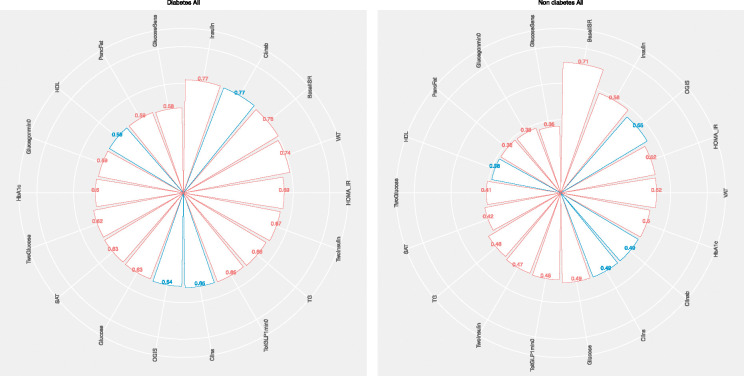
Results: High basal insulin secretion rate (BasalISR) was identified as the primary causal driver of liver fat accumulation in both diabetes and non-diabetes. Excess visceral adipose tissue (VAT) was bidirectionally associated with liver fat, indicating a self-reinforcing metabolic loop. Basal insulin clearance (Clinsb) worsened as a consequence of liver fat accumulation to a greater degree before the onset of T2D. Out of 446 analysed proteins, 34 mapped to these metabolic networks and 27 were identified in the non-diabetes network, 18 in the diabetes network, and 11 were common between the two networks. Key proteins directly associated with liver fat included GUSB, ALDH1A1, LPL, IGFBP1/2, CTSD, HMOX1, FGF21, AGRP, and ACE2. Sex-stratified analyses revealed distinct proteomic drivers: GUSB and LEP were most predictive of liver fat in females and males, respectively.

Conclusions: Basal insulin hypersecretion is a modifiable, causal driver of MASLD, particularly prior to glycaemic decompensation. Our findings highlight a multifactorial, sex- and disease-stage-specific proteo-metabolic architecture of hepatic steatosis. Proteins such as GUSB, ALDH1A1, LPL, and IGFBPs warrant further investigation as potential biomarkers or therapeutic targets for MASLD prevention and treatment.


Conflict of interest statement

DECLARATION OF INTERESTS AD works for Novo Nordisk Research Centre Oxford. SB has ownerships in Intomics A/S, Hoba Therapeutics Aps, Novo Nordisk A/S, Lundbeck A/S, and managing board memberships in Proscion A/S and Intomics A/S. MR owns stock in Novo Nordisk A/S. MMcC is an employee of Genentech and a holder of Roche stock. Within the past five years, PWF has received consulting honoraria from Eli Lilly Inc., Novo Nordisk Foundation, Novo Nordisk A/S, UBS, Qatar Foundation, and Zoe Ltd. PWF was also an employee of the Novo Nordisk Foundation (2021–2024). PWF has also received investigator-initiated grants (paid to institution) from numerous pharmaceutical companies as part of the Innovative Medicines Initiative of the European Union.

Figures

Figure 1.
Figure 1.. Proteins identified in Bayesian networks and their functional enrichment across metabolic pathways.
(Top Left) Venn diagram showing the distribution of 34 proteins identified in the Bayesian networks across non-diabetes and type 2 diabetes cohorts; (Top Right) Reactome pathway enrichment highlighting associated biological processes; (Bottom Left) Molecular function enrichment analysis; (Bottom Right) Cellular component enrichment. The background gene set for the hypergeometric test included 18,731proteining-coding genes.
Figure 2.
Figure 2.. Bayesian network of metabolic and proteomic interactions in the IMI-DIRECT non-diabetes cohort (n = 964).
The graph displays directed relationships among clinical and proteomic variables. Nodes are color-coded: blue (clinical/metabolic), green (proteins), peach (liver fat as outcome). Solid arrows represent directed associations with high confidence (strength and direction probability ≥ 0.8), while dashed arrows indicate less confident directionality. AGRP: agouti-related peptide; ALDH1A1: aldehyde dehydrogenase 1 family member A1; APOM: apolipoprotein M; BasalISR: basal insulin secretion rate at the beginning of the OGTT; CD4: cluster of differentiation 4; CDH5: cadherin-5; Clins: mean insulin clearance during OGTT; Clinsb: basal insulin clearance-calculated as (mean insulin secretion)/(mean insulin concentration); CTRC: chymotrypsin C; CTSD: cathepsin D; FGF21: fibroblast growth factor 21; Glucagonmin0: fasting glucagon; Glucose: fasting plasma glucose; GlucoseSens: glucose sensitivity; GUSB: β-glucuronidase; HbA1c: glycated haemoglobin A1C; HDL: high-density lipoprotein cholesterol; IGFBP1/2: insulin-like growth factor binding proteins 1 and 2; Insulin: fasting plasma insulin; KITLG: KIT ligand; LDLR: low-density lipoprotein receptor; LEP: leptin; LiverFat: hepatic fat content; LPL: lipoprotein lipase; MFGE8: milk fat globule-epidermal growth factor 8; OGIS: oral glucose insulin sensitivity index according to the method of Mari et al. [32]; PancFat: pancreas fat; PON3: paraoxonase 3; SAT: subcutaneous adipose tissue; TG: triglycerides; TotGLP1min0: fasting total GLP-1; TwoGlucose/TwoInsulin: 2-hour post-load values from OGTT; VAT: visceral adipose tissue.
Figure 3.
Figure 3.. Bayesian network of metabolic and proteomic interactions in the IMI-DIRECT type 2 diabetes cohort (n = 331).
The graph displays directed relationships among clinical and proteomic variables. Nodes are color-coded: blue (clinical/metabolic), green (proteins), peach (liver fat as outcome). Solid arrows represent directed associations with high confidence (strength and direction probability ≥ 0.8), while dashed arrows indicate less confident directionality. APOM: apolipoprotein M; BasalISR: basal insulin secretion rate; CD4: cluster of differentiation 4; Clins: mean insulin clearance during OGTT; Clinsb: basal insulin clearance; CTRC: chymotrypsin C; FGF21: fibroblast growth factor 21; Glucagonmin0: fasting glucagon; Glucose: fasting plasma glucose; GlucoseSens: glucose sensitivity; HDL: high-density lipoprotein cholesterol; HOMA_IR: homeostatic model assessment of insulin resistance; Insulin: fasting plasma insulin; LDLR: low-density lipoprotein receptor; LiverFat: hepatic fat content; LPL: lipoprotein lipase; MATN2: matrilin-2; MFGE8: milk fat globule-EGF factor 8; OGIS: oral glucose insulin sensitivity index according to the method of Mari et al. [32]; PancFat: pancreas fat; PON3: paraoxonase 3; SAT: subcutaneous adipose tissue; TG: triglycerides; TGM2: transglutaminase 2; TwoGlucose: 2-hour post-load glucose (OGTT); TwoInsulin: 2-hour post-load insulin (OGTT); VAT: visceral adipose tissue.
Figure 4.
Figure 4.. Posterior probabilities of MASLD based on clinical predictors across IMI-DIRECT diabetes and non-diabetes cohorts.
Radar plots display the posterior probability of MASLD (metabolic dysfunction-associated steatotic liver disease, defined as liver fat >5%) after conditioning on individual clinical variables in (Left) individuals with T2D (type 2 diabetes) and (Right) those without diabetes. Bars represent the conditional probability of MASLD given high (red bars) or low (blue bars) levels of each variable. MASLD: metabolic dysfunction-associated steatotic liver disease; T2D: type 2 diabetes; BasalISR: basal insulin secretion rate; VAT: visceral adipose tissue; SAT: subcutaneous adipose tissue; OGIS: oral glucose insulin sensitivity index; HOMA_IR: homeostatic model assessment of insulin resistance; Clinsb: basal insulin clearance; Clins: dynamic insulin clearance; TG: triglycerides; HDL: high-density lipoprotein cholesterol; HbA1c: glycated haemoglobin A1c; GLP1: glucagon-like peptide 1; OGTT: oral glucose tolerance test.
Figure 5.
Figure 5.. Posterior probabilities of MASLD based on proteomic predictors in IMI-DIRECT diabetes and non-diabetes cohorts.
Radar plots display the conditional probability of MASLD after conditioning on individual proteomic variables in (Left) T2D and (Right) non-diabetes cohorts. Bars indicate high (red) or low (blue) levels of the corresponding protein. MASLD: metabolic dysfunction-associated steatotic liver disease; T2D: type 2 diabetes; GUSB: β-glucuronidase; LEP: leptin; ALDH1A1: aldehyde dehydrogenase 1 family member A1; CTSD: cathepsin D; FGF21: fibroblast growth factor 21; IGFBP1/2: insulin-like growth factor binding proteins 1 and 2; LDLR: low-density lipoprotein receptor; MFGE8: milk fat globule-EGF factor 8; AGRP: agouti-related peptide; KITLG: KIT ligand; ACE2: angiotensin-converting enzyme 2; APOM: apolipoprotein M; CD4: cluster of differentiation 4; PON3: paraoxonase 3; TGM2: transglutaminase 2; MATN2: matrilin-2.

References

    1. Younossi ZM, Golabi P, Paik JM, Henry A, Van Dongen C, Henry L. The global epidemiology of nonalcoholic fatty liver disease (NAFLD) and nonalcoholic steatohepatitis (NASH): a systematic review. Hepatology. 2023;77(4):1335–47. - PMC - PubMed
    1. En Li Cho E, Ang CZ, Quek J, Fu CE, Lim LKE, Heng ZEQ, et al. Global prevalence of non-alcoholic fatty liver disease in type 2 diabetes mellitus: an updated systematic review and meta-analysis. Gut. 2023;72(11):2138–48. - PubMed
    1. Sveinbjornsson G, Ulfarsson MO, Thorolfsdottir RB, Jonsson BA, Einarsson E, Gunnlaugsson G, et al. Multiomics study of nonalcoholic fatty liver disease. Nat Genet. 2022;54(11):1652–63. - PMC - PubMed
    1. Hyogo H, Yamagishi S, Maeda S, Kimura Y, Ishitobi T, Chayama K. Increased insulinogenic index is an independent determinant of nonalcoholic fatty liver disease activity score in patients with normal glucose tolerance. Dig Liver Dis. 2012;44(11):935–9. - PubMed
    1. Zhang AMY, Wellberg EA, Kopp JL, Johnson JD. Hyperinsulinemia in Obesity, Inflammation, and Cancer. Diabetes Metab J. 2021;45(4):622. - PMC - PubMed

Publication types

LinkOut - more resources