. 2025 May 13;28(6):112639.
doi: 10.1016/j.isci.2025.112639. eCollection 2025 Jun 20.

IL-2 immunotherapy rescues irradiation-induced T cell exhaustion in mouse colon cancer

Affiliations

IL-2 immunotherapy rescues irradiation-induced T cell exhaustion in mouse colon cancer

Carmen S M Yong et al. iScience. .

Abstract

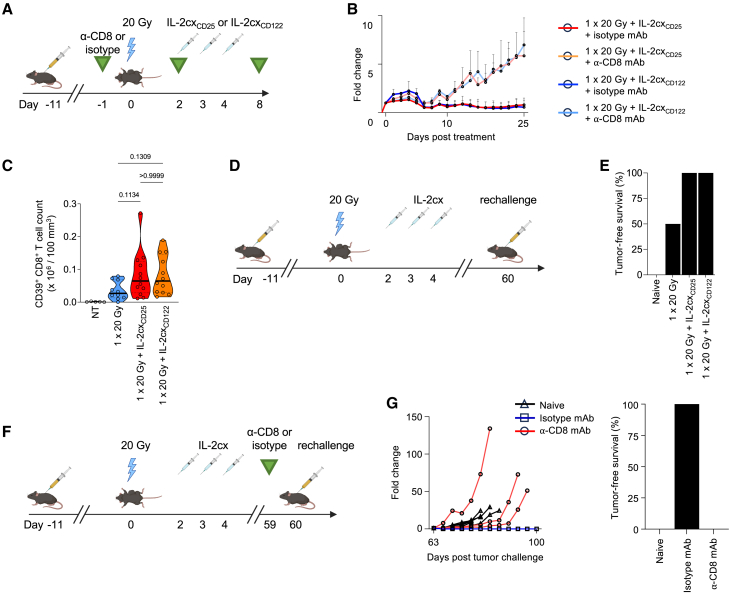
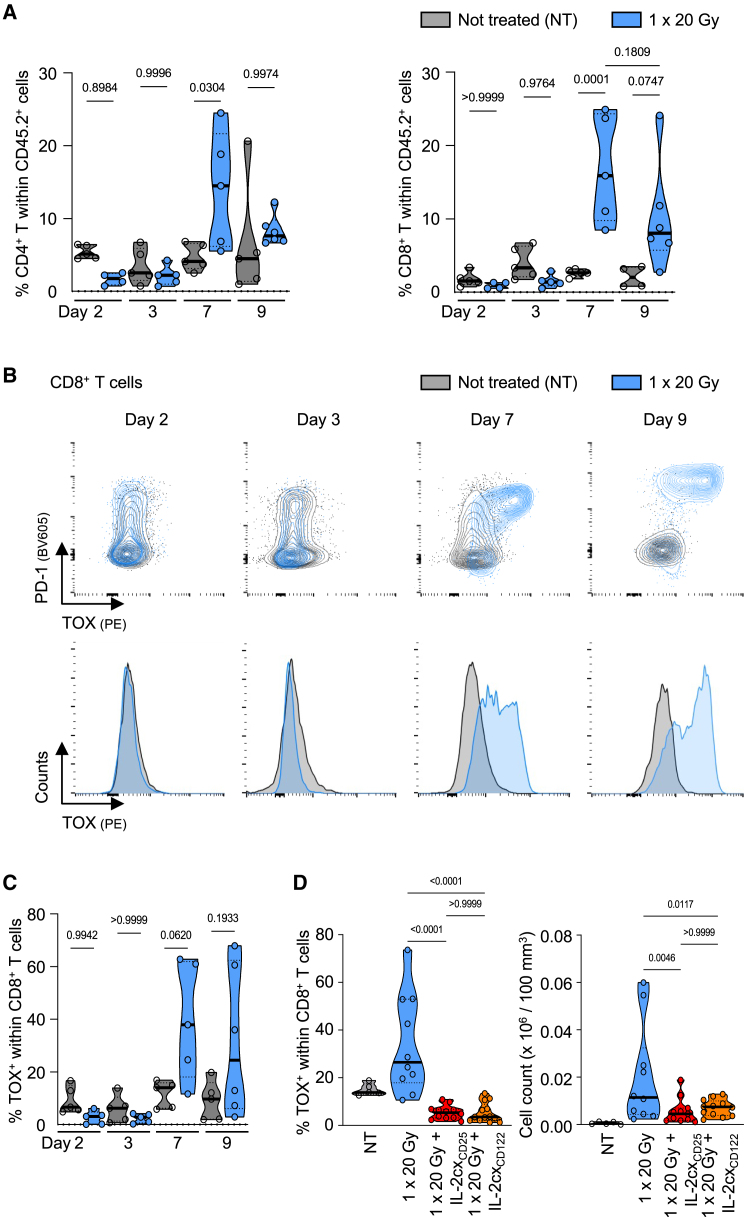
Radiotherapy (RT) can stimulate anti-cancer T cell responses, and cytokines, notably interleukin-2 (IL-2), are necessary for optimal T cell function and memory. However, timing and IL-2 receptor (IL-2R) bias of IL-2 signals are ill-defined. Using image-guided RT in a mouse colon cancer model, we observed single high-dose (20 Gy) RT transiently upregulated IL-2Rα (CD25) on effector CD8+ T cells, facilitating the use of CD25-biased IL-2 immunotherapy. Timed administration of CD25-biased IL-2 treatment after RT favored intratumoral expansion of CD8+ T cells over regulatory T cells, which resulted in comparable anti-tumor effects as with RT plus IL-2Rβ (CD122)-biased IL-2 immunotherapy. Moreover, intratumoral CD8+ T cells of animals receiving combined IL-2R-biased IL-2 and RT showed reduced markers of exhaustion. These combination treatments affected both primary irradiated and distant non-irradiated tumors and achieved durable responses. We demonstrate that timed IL-2R subunit-biased IL-2 immunotherapy synergizes with single high-dose RT to achieve potent anti-cancer immunity.

Keywords: Cancer; Immunology; Microenvironment.


Conflict of interest statement

O.B. is a shareholder of Anaveon AG, developing CD122-biased IL-2 immunotherapy for cancer. O.B. and M.E.R. hold patents on improved IL-2 formulations and are shareholders of Seito Biologics AG, which develops improved IL-2 immunotherapies for autoimmune diseases. The other authors declare no competing financial interests.

Figures

None
Graphical abstract
Figure 1
Figure 1
Single high-dose radiotherapy transiently upregulates CD25 on tumor-infiltrating CD8+ T cells (A) Schematic representation of the experimental setup. C57BL/6 mice were injected subcutaneously with MC38 cells and tumors irradiated 10–11 days later. (B) Mice were treated with 8 Gy on three consecutive days or a single dose of 20 Gy. Tumor growth was monitored until day 60 post treatment. (C) Survival curve, median survival and percentage of tumor-free mice at experiment termination. (D) Representative flow cytometry plots gated on TCRβ+ T cells in the tumor and DLN four days after irradiation. (E) Percentages of TCRβ+ T cells, CD8+ T cells, CD4+ T cells, and forkhead box p3 (Foxp3)+ regulatory T cells (Tregs) in the tumor 9 days after irradiation, and (F) ratios of CD8+ T cells to Tregs. (G) Representative flow cytometry plots gated on CD8+ T cells in tumor and tumor-draining lymph nodes (DLNs), (right) percentage of CD25+ cells in CD8+ T cells two days after irradiation. (H) Representative histograms of CD25, CD122, CD44, and Ki67 gated on CD8+ T cells in tumor and DLN four days after irradiation. (B, C, E–G) Data are represented as mean ± standard error of the mean (SEM) of one to five independent experiments. n values for (B, C): NT = 19, 3 × 8 Gy = 13, 1 × 20 Gy = 14; for (E): NT = 4; 3 × 8 Gy and 1 × 20 Gy = 12; for (G): NT = 10, 48 h = 8, 72 h = 4 (C). Differences in median survival days were taken from the survival curves and analyzed by pairwise Log rank (Mantel-Cox) test. (E–G) Differences were analyzed using a one-way ANOVA.
Figure 2
Figure 2
Combined radiotherapy and IL-2 immunotherapy efficiently controls primary tumors (A) Schematic representation of the experimental set up. 10–11 days after tumor inoculation, mice were irradiated with 20 Gy, followed by treatment with IL-2 complexes (IL-2cx) 48 h after irradiation for 3 consecutive days. (B) Tumor growth curves shown to day 60 post treatment. (C) Survival curve and median survival depicted. (D) Percentage of tumor free and tumor bearing mice at experiment termination. (B–D) Data are represented as mean ± SEM of three to four independent experiments. n values for (B–D): NT = 10, IL-2cxCD25 and 1 × 20 Gy = 12, 1 × 20 Gy + IL-2cxCD25 and 1 × 20 Gy + IL-2cxCD122 = 14. Differences in median survival days were taken from the survival curves and analyzed by pairwise Log rank (Mantel-Cox) test. IL-2cxCD25, CD25-biased IL-2/UFKAcx; IL-2cxCD122, CD122-biased IL-2/NARAcx; NT, non-treated.
Figure 3
Figure 3
Combined radiotherapy and IL-2 immunotherapy generates long-lasting anti-tumor immune responses (A) Mice were treated with a CD8-specific depleting monoclonal antibody (mAb) or an isotype-matched control mAb 24 h prior to irradiation with two additional injections at 48 h and 8 days after irradiation. (B) Tumor growth curves from experimental set up in (A). (C) Quantification of intratumoral CD39+CD8+ T cells following treatment as in Figure 2A. Tumors were harvested 9 days after irradiation and CD39+CD8+ T cells were determined by flow cytometry. (D) 10–11 days after tumor inoculation into the right flank, mice were irradiated with 20 Gy, followed by treatment with indicated IL-2cx 48 h after irradiation for 3 consecutive days and monitoring until day 60. Mice with complete remissions were re-challenged with 5 × 10⁵ MC38 cells on the left flank and tumor growth was monitored until day 100 after initial treatment. Naive non-tumor bearing mice were challenged as controls. (E) Percentage of tumor-free mice at experiment termination. (F) Tumor-bearing mice treated as in Figure 2A and in complete remission received a CD8-specific depleting mAb or an isotype-matched control mAb on day 59 after treatment initiation and were re-challenged with with 5 × 10⁵ MC38 cells on the left flank. (G) Tumor growth in mice of (F), with percentage of tumor-free mice at experiment termination. (B, C, E, and G) Data are represented as mean ± SEM of one to three independent experiments. n values for (B) 5 per group; (C) NT = 5, 1 × 20 Gy = 10, 1 × 20 Gy + IL-2cxCD25 and 1 × 20 Gy + IL-2cxCD122 = 12; (G) Naive = 5, isotype and α-CD8 = 3. Differences in median survival days were taken from the survival curves and analyzed by pairwise Log rank (Mantel-Cox) test.
Figure 4
Figure 4
Combined radiotherapy and CD25-biased IL-2 immunotherapy expands tumor-infiltrating CD8+ T cells (A) Schematic representation of the experimental set up. Experiment termination (harvest) denoted by blue triangle. (B) Percentages of TCRβ+ T cells, CD8+ T cells, CD4+ T cells, and Foxp3+ Tregs in the tumor 9 days after irradiation. (C) Ratios of CD8+ T cells to Tregs in the tumor. (D) Ratios of CD8+ T cells to Tregs in the DLN, non-draining lymph node (NDLN) and spleen. (E) Mean fluorescence intensity (MFI) of Ki67 in CD8, CD4 and Tregs from tumor (top) and DLN (bottom). MFI normalized to the same immune subtype in non-treated mice. (B-E) Data are represented as mean ± SEM of two to three independent experiments. n values for (B–E): NT = 4, IL-2cxCD25 = 6–7, 1 × 20 Gy = 11–12, 1 × 20 Gy + IL-2cxCD25 = 11–13, 1 × 20 Gy + IL-2cxCD122 = 7–9. Differences were analyzed using a one-way ANOVA.
Figure 5
Figure 5
IL-2cx immunotherapy reverts radiotherapy-induced exhaustion in tumor-infiltrating CD8+ T cells (A) Percentages of CD4+ and CD8+ T cells in CD45.2 tumor infiltrates at 2, 3, 7 and 9 days post irradiation with 20 Gy. (B) (Top) Representative flow cytometry plots and (bottom) histograms gated on tumor infiltrating CD8+ T cells regarding PD-1 and TOX expression. (C) Percentage of TOX+ in CD8+ T cells over time. (D) Percentage and total number of TOX+ cells within (top) tumor-infiltrating CD8+ and (bottom) CD4+ T cells. (A, C, and D) Data are represented as mean ± SEM of three independent experiments. n values for (A and C): NT = 4–5, 1 × 20 Gy = 4–6; (D) NT = 5, 1 × 20 Gy = 10, 1 × 20 Gy + IL-2cxCD25 = 11–12, 1 × 20 Gy + IL-2cxCD122 = 12–13. Differences were analyzed using a one-way ANOVA.
Figure 6
Figure 6
Combined radiotherapy and IL-2 immunotherapy affects abscopal tumors (A) Schematic representation of the experimental setup. (B) Primary tumor growth curves. (C) Distant, non-irradiated tumor growth curves. (D) Survival of mice to a cumulative tumor burden of 1000 mm3 and median survival days post treatment. (B–D) Data are represented as mean ± SEM of two to three independent experiments. n values for (B and C): NT = 20, 1 × 20 Gy = 21, 1 × 20 Gy + IL-2cxCD25 = 22, 1 × 20 Gy + IL-2cxCD122 = 18. Differences in median survival days were taken from the survival curves and analyzed by pairwise Log rank (Mantel-Cox) test.

References

    1. Barker H.E., Paget J.T.E., Khan A.A., Harrington K.J. The tumour microenvironment after radiotherapy: mechanisms of resistance and recurrence. Nat. Rev. Cancer. 2015;15:409–425. doi: 10.1038/nrc3958. - DOI - PMC - PubMed
    1. Baumann M., Krause M., Overgaard J., Debus J., Bentzen S.M., Daartz J., Richter C., Zips D., Bortfeld T. Radiation oncology in the era of precision medicine. Nat. Rev. Cancer. 2016;16:234–249. doi: 10.1038/nrc.2016.18. - DOI - PubMed
    1. Vanpouille-Box C., Formenti S.C., Demaria S. Toward Precision Radiotherapy for Use with Immune Checkpoint Blockers. Clin. Cancer Res. 2018;24:259–265. doi: 10.1158/1078-0432.CCR-16-0037. - DOI - PMC - PubMed
    1. Demaria S., Ng B., Devitt M.L., Babb J.S., Kawashima N., Liebes L., Formenti S.C. Ionizing radiation inhibition of distant untreated tumors (abscopal effect) is immune mediated. Int. J. Radiat. Oncol. Biol. Phys. 2004;58:862–870. doi: 10.1016/j.ijrobp.2003.09.012. - DOI - PubMed
    1. Dewan M.Z., Galloway A.E., Kawashima N., Dewyngaert J.K., Babb J.S., Formenti S.C., Demaria S. Fractionated but not single-dose radiotherapy induces an immune-mediated abscopal effect when combined with anti-CTLA-4 antibody. Clin. Cancer Res. 2009;15:5379–5388. doi: 10.1158/1078-0432.CCR-09-0265. - DOI - PMC - PubMed

LinkOut - more resources