[Preprint]. 2025 May 30:rs.3.rs-6682089.
doi: 10.21203/rs.3.rs-6682089/v1.

Identification of cross-stage, cross-species malaria CD8+ T cell antigens

Affiliations

Identification of cross-stage, cross-species malaria CD8+ T cell antigens

Camila R R Barbosa et al. Res Sq. .

Abstract

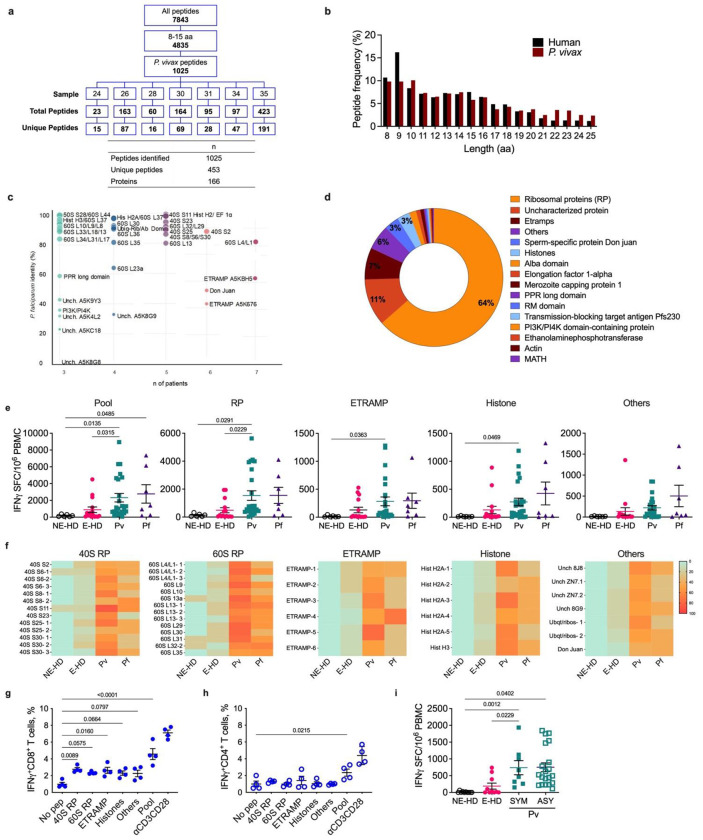
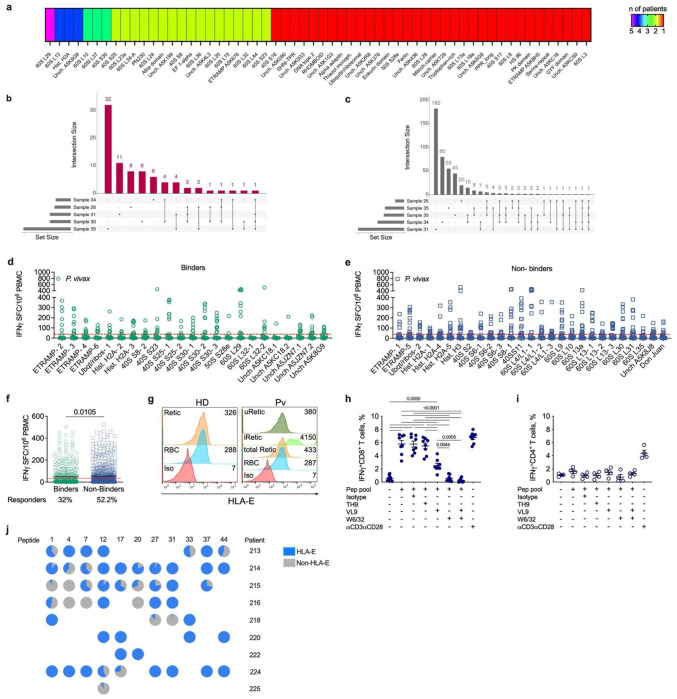
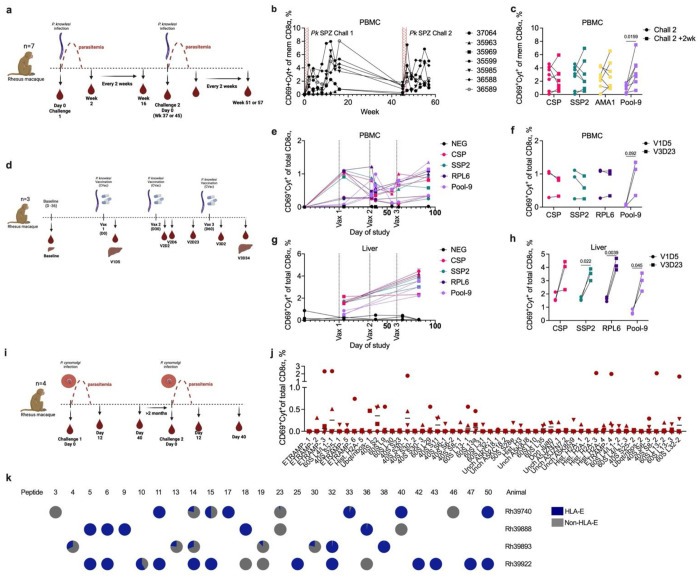
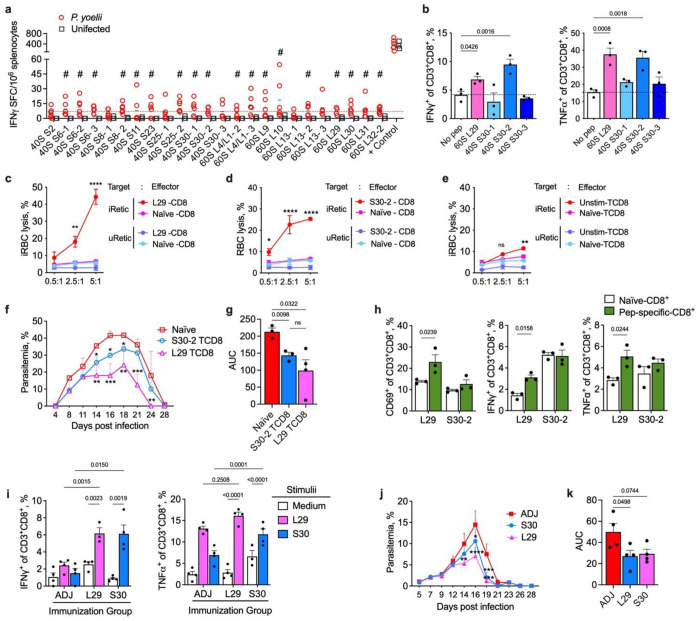
Malaria is one of the most prevalent parasitic diseases in the world. In 2023, 263 million malaria cases were estimated worldwide1. Two species of Plasmodium, P. falciparum and P. vivax, cause most human malaria. Despite the licensing of two partially protective vaccines for P. falciparum, there is no vaccine capable of providing long-term control or elimination2,3. A major limitation for vaccine development is the lack of validated T cell epitopes for either species that could be targeted by vaccines. P. vivax is the most widespread human malaria parasite and is the major species causing malaria in the Americas and Asia while P. falciparum is more prevalent in Africa1. P. vivax exclusively infects reticulocytes in peripheral blood, which, unlike the mature erythrocytes infected by P. falciparum, still retain RNA and therefore retain host protein translation capabilities4. We previously reported that P. vivax-infected reticulocytes express the major human leukocyte antigen class I (HLA-I), which allows parasite sensing by CD8+ T cells and consequent killing of parasite-infected host cells and intracellular parasites5. Here we report by immunopeptidomic analysis the first unbiased identification of Plasmodium spp. antigens presented via HLA-I on infected reticulocytes. We identified 453 unique peptides that mapped to 166 different proteins. Most of these antigens were housekeeping proteins that are constitutively expressed at multiple stages of the parasite life cycle. Common peptides were presented in different individuals by the same or distinct HLA-ABC alleles as well as by non-classical HLA-E. Many peptide sequences were highly conserved in P. falciparum and P. vivax. The immunogenicity of the newly identified epitopes was validated in both P. vivax- and P. falciparum-infected patient samples. Furthermore, several of these antigens were immunogenic in the blood and liver of non-human primates following Plasmodium infection and attenuated parasite immunization. Two antigens were also the target of protective CD8+ T cell-mediated immunity in rodents. Thus, these antigens have potential for use in a cross-stage and cross-species malaria vaccine.


Conflict of interest statement

Additional Declarations: There is NO Competing Interest. Competing interest declaration The authors declare no competing financial interests.

Figures

Figure 1 |
Figure 1 |. Peptide identification and immunogenicity validation.
a, Summary of peptides identified by LC-MS/MS using databases containing the human (Uniprot- UP000005640 - Version 09-2019) and P. vivax (Pv) Sal-1 (Uniprot- UP000008333- v 08-2019) proteomes. Unique peptides across the samples were selected according to size (between 8 and 15 amino acids) and presence in the predicted Pv proteome but not human proteome. b, Frequencies (in percent of total) of peptide length within unique human and Pv peptides spanning from 8 to 25 amino acids. c, Antigens found in at least 3 patients were plotted by their percent identity to their respective P. falciparum (Pf) orthologs versus the number of patients in which they were found (indicated by colour intensity where light blue is the minimum and dark pink the maximum) and identity to Pf by dot diameter (the larger the diameter, the greater the shared identity). d, Frequencies of the protein families to which the identified Pv proteins belong. e-f, ELISpot results for selected peptides tested using PBMC isolated from patients infected with Pv (n=24), Pf (n=7), or healthy donors from malaria endemic (E-HD; n=15) and non-endemic (NE-HD; n=6) regions. e, PBMC were stimulated with a pool of each of 50 peptides or pools of peptides derived from ribosomal proteins (RP), early transcribed membrane proteins (ETRAMP), histone and other proteins. IFNγ production was measured by ELISpot and the results are expressed as spot-forming cells (SFC) per 1x10⁶ PBMC. f, The percentages of positive individuals for each peptide tested by each infected or healthy group are depicted by colour intensity. Green, orange and red represent low, middle, or high levels of responders in the ELISpot assay, respectively. g-h, Peptide pools prepared according to the antigen family group were used to stimulate PBMC from P. vivax symptomatic patients (n=4). Frequencies of IFNγ producing CD8+ T cells (g) or CD4+ T cells (h) were determined by flow cytometric intracellular cytokine staining. αCD3 and αCD28 monoclonal antibodies were used as positive control and a no-peptide condition as negative control. i, ELISpot results obtained with PBMC from E-HD (n=10), NE-HD (n=10), Pv symptomatic (SYM; n=8) and Pv asymptomatic (ASY; n=20) patients upon stimulation with a pool of all 50 peptides. e, g-i, Statistical analyses were performed by one-way ANOVA. Comparison across multiple groups was performed by Kruskal Wallis test. Actual P values are shown.
Figure 2 |
Figure 2 |. Classical and non-classical HLA peptide binders.
a, Proteins containing peptides predicted to bind with high affinity to HLA-A, B or C alleles according to NetMHC. The color intensity represents the number of patients for whom peptides were predicted to bind to HLA-A,B or C (violet: maximum; red: minimum). b-c, UpSet plots visualizing the intersections of peptides found in different samples. Each column corresponds to a specific section in a traditional Venn diagram. Each row corresponds to one sample. The number of total peptides in the respective sample is indicated by horizontal bars. Connected, dark circles in the matrix indicate samples that share the same peptides (b, P. vivax (Pv); c, human). d-f, Peptides tested by ELISpot assay in Pv-infected patients were segregated into binders (d) or non-binders (e) based on NetMHC analysis. IFNγ production was measured by spot counting and the results are expressed as spot-forming cells (SFC) per 1x10⁶ PBMC. Responses to peptides were considered positive when ≥30 spots were recorded, as indicated by the red threshold line. f, Comparative analysis of IFNγ ELISpot results between peptides that bind (binders) and do not bind (non-binders) to HLA-A, B or C. g, Representative histogram of HLA-E staining on uninfected reticulocytes (uRetic) and erythrocytes (uRBC) from a healthy donor (HD) or a Pv-infected patient, and iRetic from the same patient. Median Fluorescence Intensity (MFI) is shown in the upper right of each histogram. h-j, PBMC from P. vivax-infected patients (n=8) were incubated with different combination of blocking reagents for HLA-E (VL9 peptide) and for pan HLA class I mAb (W6/32), or their negative controls (TH9 peptide or isotype mAb, respectively) prior to stimulation with a pool of all 50 peptides (h, i) or single peptides (j). Conditions without peptide were included as a negative control. aCD3 and aCD28 mAbs were used as a positive control. IFN γ production by CD8+ T cells (h, j) or CD4+ T cells (i) was determined by intracellular cytokine staining. j, the pie charts show the proportion of HLA-E-dependent (i.e. VL9 blocked) and non-HLA-E-dependent responses across different patients for individual peptides. Statistical analyses were performed by Mann Whitney test (f) and by one-way ANOVA, with Kruskal Wallis test (h-i). Actual P values are shown.
Figure 3 |
Figure 3 |. Novel Plasmodium antigens are recognized by T cells elicited during P. knowlesi (Pk) and P. cynomolgi (Pcy) infection of non-human primates.
a, Schematic of repeated Pk sporozoite infection of rhesus macaques (n=7). Infection was initiated by intravenous injection of 2,500 purified, cryopreserved Pk sporozoites. After development of >2% parasitemia and treatment on days 10-12, blood samples were taken every two weeks to assess peripheral immune responses via ICS. This was repeated at either 37- or 45-weeks post-infection. b, CD8+ T cell responses to a pool of 9 P. vivax peptides conserved in Pk (Pool-9) in the peripheral blood of rhesus macaques following two sporozoite infections. The relative frequency of CD8+ T cell responses as defined by CD69 expression together with either IFNγ or TNFα is shown. Each animal is denoted by a unique symbol with timepoints connected by a line. Pink shading indicates the period of parasitemia. c, Pair-wise comparison of CD8+ T cells responding to overlapping peptides of indicated Pk antigens (CSP, SSP2, AMA1) or Pool-9 to assess boosting of CD8+ T cell response following a second infection. d, Schematic chemoprophylaxis vaccination (“Cvac”) where animals were injected with 50,000 purified cryopreserved Pk sporozoites under weekly chloroquine coverage plus coartem on days 7-9 post-infection. Immunizations were repeated at monthly intervals for a total of three immunizations. At indicated time points, peripheral blood with or without liver biopsies was taken to assess immune responses. e, Longitudinal CD8+ T cell responses in peripheral blood to overlapping peptides of indicated antigens or novel antigens. Each animal is denoted by a unique shape with timepoints connected by a line. f, Pair-wise comparisons of peripheral immune responses as in c. g, Same as in e employing liver lymphocytes. h, Same as in c employing liver lymphocytes. i, Schematic of repeated Pcy infection of rhesus macaques (n=4). Infection was initiated by intravenous injection of 36,000 cryopreserved Pcy Berok infected red blood cells. Blood samples were taken 12 days and 40 days after infection to assess peripheral immune responses. This was repeated >2 months post-infection. j, CD8+ T cell responses to each of the 50 conserved peptides in the peripheral blood of rhesus macaques 12 days after first in inoculation with Pcy-iRBC. Responding CD8+ T cells were defined as expressing CD69 and either IFNγ or TNFα, and frequencies of CD69+cytokine+ cells are shown after subtraction of responses from a DMSO control. Each animal is denoted by a unique symbol. k, the proportion of HLA-E-restricted CD8+ T cell responses was measured against a selection of conserved antigens after secondary infection with Pcy-iRBC. Antigens that induced a CD8+ T cell response after primary infection of each animal were selected for stimulation in the presence or absence of the HLA-E blocking peptide VL9. Total CD8+ T cell responses 12 days (39740, 39888, and 39992) or 40 days (39893) after secondary infection are shown with the proportion of HLA-E-restricted responses shown in blue and non-HLA-E-restricted responses shown in gray. Statistical analyses were performed by paired t test (c, f, h). Actual P values are shown.
Figure 4 |
Figure 4 |. Antigen validation in the P. yoelii (Py) malaria experimental model.
a, IFNγ ELISpot results for T cell responses to indicated peptides in Py infected mice. Mice were infected with 105 Py iRBC. At 12 days post-infection (dpi), mouse splenocytes were isolated and incubated with selected peptides. Each circle represents one individual mouse. Red circles are Py infected mice (n=6), and black squares are uninfected mice (n=3). IFNγ production was measured by spot counting, and the results are expressed as SFC per 1x10⁶ splenocytes. Peptides were considered positive (#) when the group average was higher than 7 spots, shown by the red dashed line. b-e, Ag-CD8+ T cells were generated by in vitro expansion. Splenocytes were collected at 12 dpi and stimulated with each shown peptide in 12-day intervals. Cells were restimulated using Mitomicyn-treated APC from uninfected mice, pulsed with peptides. b, IFNγ and TNFα production by CD3+ CD8+ cells was evaluated by ICS, 12 days after a second peptide stimulation. c-e, Py iRetic and uRetic were labeled by CFSE and co-cultured with naïve CD8+ T cells, Ag-stimulated CD8+ T cells (c: L29.1 peptide; d: S30.2 peptide;) or unstimulated CD8+ T cells (e) at different effector: target ratios. Retics lysis was accessed by flow cytometry. f-h, Adoptive transfer of Ag-CD8+ T cells in the Py experimental model. f-g Mice (n=4) received 1.5x10⁶ Ag-CD8+ T cells at days 0 and 4, challenged with 105 Py-iRBC, and followed for parasitemia for 28 days. f, Percentage of Py parasitemia after adoptive transfer. g, Area under the curve (AUC) relative to the parasitemia data. h, At 30 dpi, splenocytes were harvested and stained for activation marker (CD69) and cytokine production (IFNγ and TNFα) in CD3+CD8+ cells. i-k, Evaluation of immune protective responses induced by P. vivax ribosomal proteins (L29, S30). Mice (n=10) were immunized thrice with 10 μg of target protein plus adjuvant solution (18 μg CpG B344 adsorbed in Alum 30% v/v) at a 14-day interval and compared to the adjuvant alone group (ADJ). 21 days after the last immunization, blood samples were collected and spleens harvested (n=4) to assess the immune response to each target protein. On day 49, the remaining mice (n=6) were challenged with 105 Py-iRBC, and the parasitemia was monitored for 28 days. i, ICS for IFNγ and TNFα production in CD3+CD8+ cells. j, Percentage of Py parasitemia in L29 and S30 immunized groups compared to adjuvant control. k, Area under the curve (AUC) relative to the parasitemia data. Statistical analyses were performed by two-way ANOVA test followed by Šídák’s multiple comparisons test. Actual P values are shown or represented by *P < 0.05, **P <0.01, ***P <0.001, **** P<0.0001.

References

    1. WHO. World malaria report 2024. (World Health Organization, Geneva, 2024).
    1. White M. T. et al. Immunogenicity of the RTS,S/AS01 malaria vaccine and implications for duration of vaccine efficacy: secondary analysis of data from a phase 3 randomised controlled trial. Lancet Infect Dis 15, 1450–1458 (2015). 10.1016/S1473-3099(15)00239-X - DOI - PMC - PubMed
    1. Datoo M. S. et al. Safety and efficacy of malaria vaccine candidate R21/Matrix-M in African children: a multicentre, double-blind, randomised, phase 3 trial. Lancet 403, 533–544 (2024). 10.1016/S0140-6736(23)02511-4 - DOI - PubMed
    1. Leong Y. W., Russell B., Malleret B. & Renia L. Erythrocyte tropism of malarial parasites: The reticulocyte appeal. Front Microbiol 13, 1022828 (2022). 10.3389/fmicb.2022.1022828 - DOI - PMC - PubMed
    1. Junqueira C. et al. Cytotoxic CD8(+) T cells recognize and kill Plasmodium vivax-infected reticulocytes. Nat Med 24, 1330–1336 (2018). 10.1038/s41591-018-0117-4 - DOI - PMC - PubMed

METHODS ONLY REFERENCES

    1. Boyum A. Isolation of mononuclear cells and granulocytes from human blood. Isolation of monuclear cells by one centrifugation, and of granulocytes by combining centrifugation and sedimentation at 1 g. Scand J Clin Lab Invest Suppl 97, 77–89 (1968). - PubMed
    1. The Plasmodium Genome Database, C. PlasmoDB: An integrative database of the Plasmodium falciparum genome. Tools for accessing and analyzing finished and unfinished sequence data. The Plasmodium Genome Database Collaborative. Nucleic Acids Res 29, 66–69 (2001). 10.1093/nar/29.1.66 - DOI - PMC - PubMed
    1. Lopez-Barragan M. J. et al. Directional gene expression and antisense transcripts in sexual and asexual stages of Plasmodium falciparum. BMC Genomics 12, 587 (2011). 10.1186/1471-2164-12-587 - DOI - PMC - PubMed
    1. Zanghi G. et al. A Specific PfEMP1 Is Expressed in P. falciparum Sporozoites and Plays a Role in Hepatocyte Infection. Cell Rep 22, 2951–2963 (2018). 10.1016/j.celrep.2018.02.075 - DOI - PMC - PubMed
    1. Tarun A. S. et al. A combined transcriptome and proteome survey of malaria parasite liver stages. Proc Natl Acad Sci U S A 105, 305–310 (2008). 10.1073/pnas.0710780104 - DOI - PMC - PubMed

Publication types

LinkOut - more resources