[Preprint]. 2025 Jun 3:rs.3.rs-6498803.
doi: 10.21203/rs.3.rs-6498803/v1.

Subcutaneous Adipose Tissue-Secreted Proteins as Endocrine Regulators of Physical and Cognitive Function in Older Adults

Affiliations

Subcutaneous Adipose Tissue-Secreted Proteins as Endocrine Regulators of Physical and Cognitive Function in Older Adults

Lauren Sparks et al. Res Sq. .

Update in

Abstract

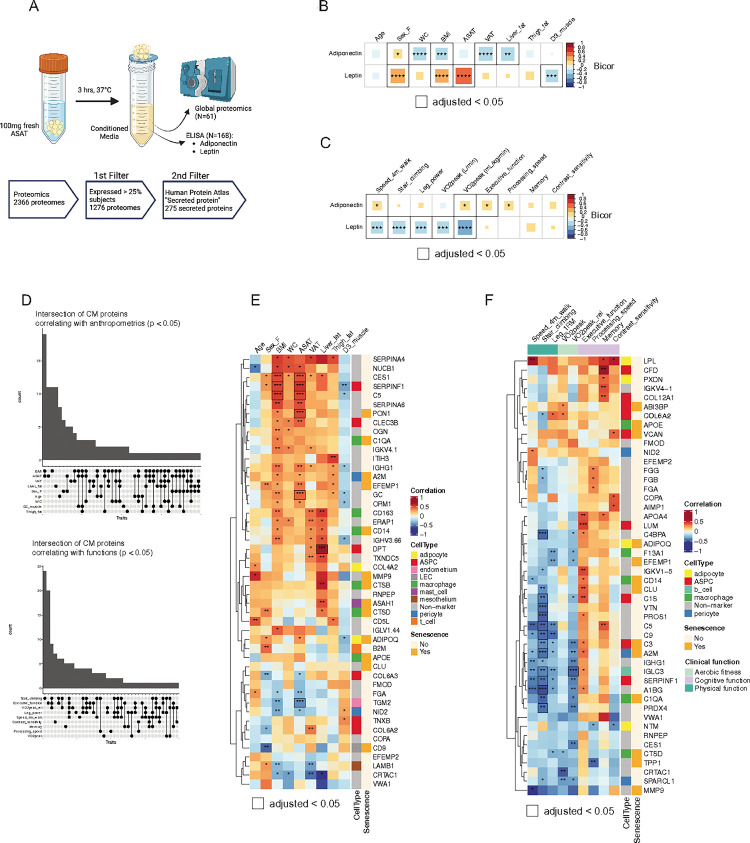
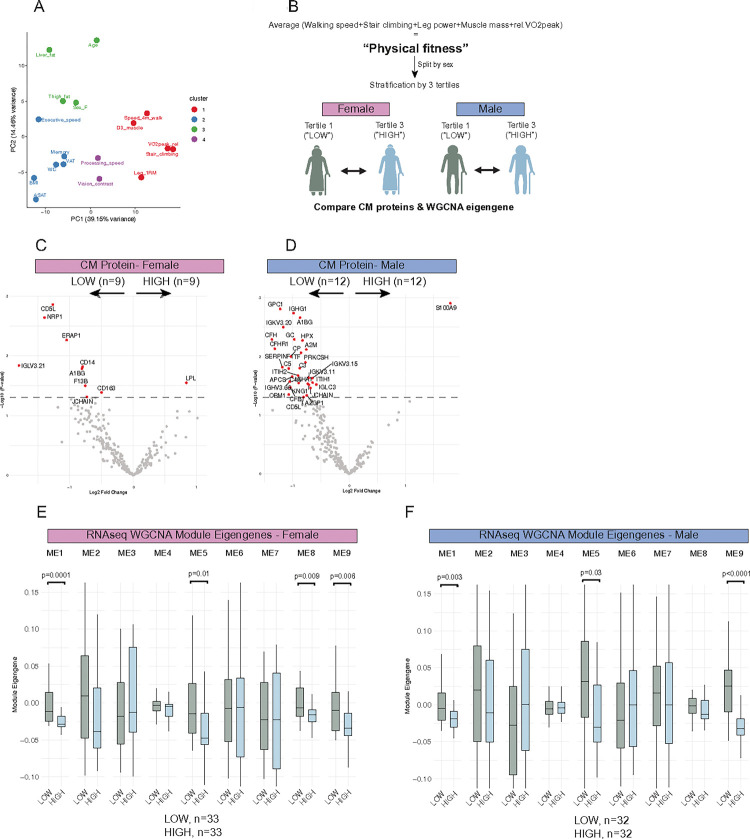
Declines in skeletal muscle and cognitive function in older adults have been linked to abnormalities in abdominal subcutaneous adipose tissue (ASAT), yet the underlying molecular mediators remain poorly understood. Here, leveraging ASAT transcriptomics and explant-conditioned media proteomics from participants in the Study of Muscle, Mobility and Aging (SOMMA; age ≥70 years, n = 229), we identified ASAT gene clusters and secreted proteins strongly associated with comprehensive assessments of physical and cognitive function in older adults. ASAT inflammation and secreted immunoglobulins were identified as key signatures of aging-associated physical and cognitive performance limitations. Systems genetics analysis confirmed secreted-SERPINF1 as a negative regulator of skeletal muscle contraction and highlighted its potential role in inducing inflammation in the heart in silico. Additionally, novel ASAT-secreted proteins such as NID2 and APOA4 were implicated in mediating ASAT crosstalk with skeletal muscle and brain in silico. Our framework provides insights into ASAT-driven tissue crosstalk underlying physical and cognitive performance in older adults and offers a valuable resource for understanding the role of ASAT in human aging.


Conflict of interest statement

COMPETING INTERESTS PMC reports consulting income and stock ownership in Myocorps.

Figures

Figure 1
Figure 1. Study design and inter-clinical trait associations.
A) Flow chart of subject recruitment, sample collection, and sample analysis. B) Venn diagram showing the distribution of sample analyses. C). Inter-clinical trait correlation of enrolled participants (N=229). MSO, Management service organization; MD, Medical doctor; ASAT, Abdominal subcutaneous adipose tissue; ELISA, Enzyme-Linked Immunosorbent Assay; LC/MS, Liquid Chromatography Mass Spectrometry. “adjusted p<0.05, “*adjusted p<0.01, “**adjusted p<0.001.
Figure 2
Figure 2. ASAT transcript clusters are associated with skeletal muscle and cognitive functions.
A) Venn diagrams of significantly associated ASAT transcripts with anthropometric traits (p<0.05). B) Venn diagrams of significantly associated ASAT transcripts with functional traits (p<0.05). C) Number of genes in each module. Genes that do not fit well into any modules are placed in Module 0. D) Heatmap of correlation matrix between module eigengens and clinical traits. *p<0.05, **p<0.01, ***p<0.001. E) Network plots of the top 20 hub genes for modules 3 and 9. F) Top 10 overrepresented pathways from each module. There were no significantly enriched pathways from modules 6 or 8. G) Distribution of Module 9 member genes across different adipose tissue cell types. A total of 90 genes were mapped using cell-type marker genes from Emont et al., 2022. Genes were allowed to overlap across multiple cell types. H) An integrated senescence gene list (1369 genes) was curated by combining four different datasets. Then, the percentage of senescence genes per module was calculated. SkM, Skeletal Muscle; GO:BP, Gene Ontology: Biological Process; ME, Module eigengene; FDR, False Discovery Rate. Sample N = 192.
Figure 3
Figure 3. ASAT-secreted proteins are associated with skeletal muscle and cognitive functions.
A) Schematics of ASAT CM collection and secretome measurements. Correlation matrix between ELISA-measured adipokines (adiponectin and leptin) and B) anthropometric and C) functional traits. Sample N = 168. D) Upset plots depicting intersections of anthropometric/functional traits on significantly associated secreted proteins measured by proteomics (p<0.05). Bars corresponding to black dots represent the count of significantly associated proteins. Connecting lines represent the intersection of significantly associated proteins among traits. Sample N=61. Correlation matrix between proteomics-measured secreted proteins and E) anthropometric or F) functional traits. ‘Non-marker’ represents transcripts that were not identified as cell-type specific markers (i.e., |log⁡2FC|<1). Top 5 secreted proteins are shown for each trait if there were more than 5 significantly associated secreted proteins. * p<0.05, ** p<0.01, *** p<0.001. **** p<0.0001. Black outline indicates adjusted p<0.05, which was obtained from Benjamini-Hochberg multiple testing correction. Sample N=61. CM, Conditioned media; Bicor, Biweight midcorrelation coefficient.
Figure 4
Figure 4. Integration of ASAT transcripts and secreted proteins.
A) Correlation between secreted protein abundances and their protein-coding transcript expressions. ‘Low expressed’ refers to genes that were excluded before WGCNA analysis due to lower expression. *p<0.05, **p<0.01. B) Secreted proteins that are significantly associated with module eigengenes. (p<0.05). Top 20 secreted proteins are shown. C) Correlation matrix between mean abundance of immunoglobulin chains and clinical traits. *p<0.05, **p<0.01. The black outline indicates adjusted p <0.05, which was obtained from Benjamini-Hochberg multiple testing correction. Sample N=48.
Figure 5
Figure 5. Validation of endocrine effects of ASAT-secreted proteins via systems genetics.
A) Workflow of GD-CAT analysis. B) Pie chart and bar plots show significantly associated genes (adjusted p<0.001) in all tissues with ASAT-derived protein candidates using GTEx cohorts (“Younger”, 20–59 years; “Older”, 60–79 years). Enrichment plot shows overrepresented pathways in target tissues from genes significantly associated with ASAT-derived protein candidates using GTEx cohorts. B) Pan tissue correlation with SAT-SERPINF1. C) Enrichment plots from target tissue genes (heart, skeletal muscle) that correlated with SAT-SERPINF1. D) Pan tissue correlation with SAT-NID2. D) Enrichment plots from target tissue genes (VAT, skeletal muscle) that correlated with SAT-NID2. F) Pan tissue correlation with SAT-APOA4. C) Enrichment plots from target tissue genes (pituitary) that correlated with SAT-APOA4. Gene ontology databases (Biological process, BP; cellular component, CC; molecular function, MF) were used for enrichment analysis. GD-CAT, Gene-Derived Correlations Across Tissues; GTEx, The Genotype-Tissue Expression; SAT, Subcutaneous Adipose Tissue; VAT, Visceral Adipose Tissue; NES, Normalized Enrichment Score.
Figure 6
Figure 6. Older adults with higher ‘physical fitness’ have distinct ASAT transcripts and secreted protein profiles.
A) PCA analysis of the correlation between clinical traits and secreted proteins. K-means clustering was used to group clinical traits into clusters. The number of centers was set to four. Sample N=61. B) Flow of participants stratification by ‘physical fitness’. C) Volcano plot of differentially expressed secreted proteins in LOW vs. HIGH females (p<0.05). LOW, n = 9; HIGH, n=9. D) Volcano plot of differentially expressed secreted proteins in LOW vs. HIGH males (p<0.05). LOW, n=12; HIGH, n=12. E) Comparison of WGCNA ME between LOW vs. HIGH females. LOW, n=33; HIGH, n=33. F) Comparison of WGCNA ME between LOW vs. HIGH males. LOW, n=32; HIGH, n=32. Rel.VO2peak, Relative VO2peak (ml/kg/min). PCA, Principal component analysis; ME, Module eigengene.

References

    1. Nair KS. Aging muscle. Am J Clin Nutr. 2005;81(5):953–63. - PubMed
    1. Yankner BA, Lu T, and Loerch P. The aging brain. Annu Rev Pathol Mech Dis. 2008;3(1):41–66. - PubMed
    1. Jackson AS, Sui X, Hébert JR, Church TS, and Blair SN. Role of lifestyle and aging on the longitudinal change in cardiorespiratory fitness. Archives of internal medicine. 2009;169(19):1781–7. - PMC - PubMed
    1. Mau T, Barnes HN, Blackwell TL, Kramer PA, Bauer SR, Marcinek DJ, et al. Lower muscle mitochondrial energetics is associated with greater phenotypic frailty in older women and men: the Study of Muscle, Mobility and Aging. Geroscience. 2024;46(2):2409–24. - PMC - PubMed
    1. Frontera WR, Hughes VA, Fielding RA, Fiatarone MA, Evans WJ, and Roubenoff R. Aging of skeletal muscle: a 12-yr longitudinal study. Journal of applied physiology. 2000;88(4):1321–6. - PubMed

Publication types

LinkOut - more resources