. 2025 Aug;10(8):101270.
doi: 10.1016/j.jacbts.2025.03.002. Epub 2025 Jun 11.

Periodontitis Accelerates Progression of Heart Failure With Preserved Ejection Fraction in Mice

Affiliations

Periodontitis Accelerates Progression of Heart Failure With Preserved Ejection Fraction in Mice

Samar Daana et al. JACC Basic Transl Sci. 2025 Aug.

Abstract

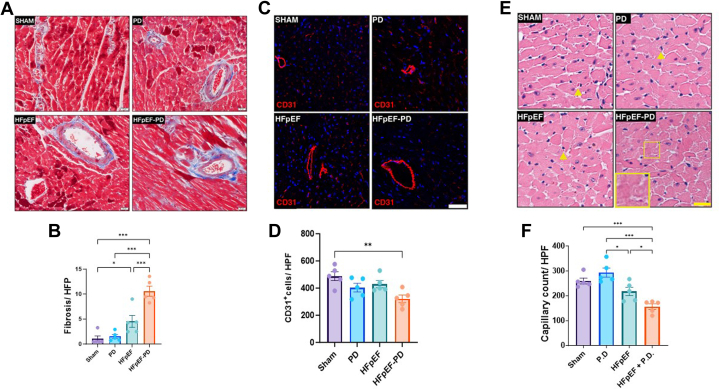
Chronic low-grade inflammation and nitric oxide (NO) depletion are important contributors to heart failure with preserved ejection fraction (HFpEF) pathophysiology. Periodontitis (PD) is a common inflammatory disease implicated in dysregulation of NO hemostasis. Epidemiological studies have shown an association between PD and increased risk of cardiovascular disease, including heart failure. However, a causative relationship between the 2 diseases has not yet been proven. In this study, we sought to investigate the direct effect of PD induction on HFpEF progression in a mouse model. Induction of PD in HFpEF mice resulted in significant oral microbial dysbiosis, accelerated progression of diastolic dysfunction by echocardiography, and increased myocardial inflammation and fibrosis. These deleterious effects seen with PD were shown to be mediated by increased systemic blood pressure, increased systemic inflammation, and NO depletion. Our study provides evidence of potential mechanistic links between PD and HFpEF progression and suggests PD as a new therapeutic target for HFpEF.

Keywords: endothelial dysfunction; heart failure with preserved ejection fraction; inflammation; nitric oxide; oral microbiome; periodontitis.


Conflict of interest statement

Funding Support and Author Disclosures This work was supported in part by a grant from the Israel science foundation (ISF) (to Dr Asleh). The authors have reported that they have no relationships relevant to the contents of this paper to disclose.

Figures

None
Graphical abstract
Figure 1
Figure 1
Systemic Effects of Treatments on the Different Mice Groups during the Experimental Period of 10 Weeks (A) Experimental design of concurrent heart failure with preserved ejection fraction (HFpEF) and periodontitis (PD) (HFpEF-PD mice). Sham mice were treated with chow diet only without Nw-nitro-L-arginine methyl ester (L-NAME) administration and without oral infection with P. gingivalis. PD mice were treated with chow diet without L-NAME administration but with P. gingivalis infection at the same time points outlined. HFpEF mice were treated with high-fat diet (HFD) and L-NAME at the same time points outlined but without P. gingivalis infection. (B) Body weight (BW) was measured on the same day of every week for 10 weeks. n = 12 mice per group. (C) Blood glucose levels were measured every 2 weeks. n = 12 mice per group. (D) Evaluation of residual alveolar bone volume (BV) loss induced by oral infection with P. gingivalis. Mice (n = 6 per group) were challenged orally 3 times at 2-day intervals with P. gingivalis. 6 weeks later, the jaws were harvested, and the alveolar BV was measured using micro-CT. (E) Heart rate. n = 12 mice per group. All results are expressed as the mean ± SEM. (B) Repeated measures 2-way analysis of variance followed by Dunnett's multiple comparisons test. Mice with HFpEF and HFpEF-PD gained weight similarly and had significantly greater weight gain over time compared with sham and PD-alone mice; ∗P < 0.05; ∗∗P < 0.01; ∗∗∗P < 0.001. (C) Repeated measures 2-way analysis of variance followed by Dunnett's multiple comparisons test; ∗∗∗P < 0.001 sham vs HFpEF and sham vs HFpEF-PD, ∗P < 0.05 sham vs HFpEF and HFpEF-PD as well as PD vs HFpEF and HFpEF-PD. (D and E) 1-way analysis of variance followed by Tukey’s multiple-comparisons test; ∗P < 0.05; ∗∗P < 0.01. BP = blood pressure.
Figure 2
Figure 2
Effects of PD on Systolic and Diastolic Cardiac Function in Mice With or Without HFpEF (A) Left ventricular end-systolic diameter (LVESD). n = 9 mice per group. (B) Left ventricular end-diastolic diameter (LVEDD). n = 9 mice per group. (C) Left ventricular ejection fraction (LVEF). n = 12 mice per group. (D) Septal mitral annulus velocity by tissue Doppler (e′). n = 12 mice per group. (E) Ratio between mitral inflow velocity (E) and e′ (E/e′). n = 12 mice per group. (F) Representative pulsed-wave Doppler (top) and tissue Doppler (bottom) tracings. Images are representative of twelve independent mice. (G) Left ventricular global longitudinal strain (GLS). n = 12 mice per group. (H) Left ventricular weight (LVW) normalized to tibial length (g/cm). Data are presented as mean ± SEM (SEM). (A to H) 1-way analysis of variance followed by Tukey’s multiple-comparisons test. ∗P < 0.05; ∗∗P < 0.01; ∗∗∗P < 0.001. Abbreviations as in Figure 1.
Figure 3
Figure 3
Changes in Plasma Nitrate Levels and Blood Pressure Measurements after PD Induction and the Effect of Treatment With Valsartan on Blood Pressure in HFpEF-PD Mice (A) Nitrate levels in plasma of the different experimental mice. n = 11 mice per group. (B) Systolic blood pressure (SBP). n = 12 mice per group. (C) Diastolic blood pressure (DBP). n = 12 mice per group. (D) Mean blood pressure (BP). n = 12 mice per group. (E to G) Effect of valsartan treatment on BP measurements in HFpEF-PD mice, n = 6-17 mice per group. (E) Baseline (week 8) and endpoint (week 10) SBP measurements. (F) Baseline and endpoint DBP measurements. (G) Baseline and endpoint mean BP measurements. Data are shown as mean ± SEM. 1-way analysis of variance followed by Tukey’s multiple-comparisons test; ∗P < 0.05; ∗∗P < 0.01; ∗∗∗P < 0.001. Abbreviations as in Figure 1.
Figure 4
Figure 4
Effects of PD on Peripheral Blood Proinflammatory Cytokine Levels and Myocardial Inflammation (A) Tumor necrosis factor alpha (TNF-α). n = 7 mice per group. (B) interferon-γ (IFN-γ). n = 6 mice per group. (C) Interleukin (IL)-1β. n = 7 mice per group. (D) IL-6. n = 7 mice per group. (E) IL-17. n = 8 mice per group. (F) Representative fluorescent images of a left ventricular tissue after immunofluorescence staining with CD3 antibodies (red). Nuclei are stained with DAPI (blue). Magnification ×40. The scale bar is 50 μm. (G) CD3+ cells per high power field. n = 5 mice per group. (H) Representative fluorescent images of left ventricular tissue after immunofluorescence staining with CD11b antibodies (red). Nuclei are stained with DAPI (blue). Magnification ×30. The scale bar is 50 μm. (I) CD11b+ cells per high power field. n = 5 mice per group. Data are shown as mean ± SEM (SEM). (A to I) 1-way analysis of variance followed by Tukey’s multiple-comparisons test. (C) Kruskal-Wallis test followed by Dunn's multiple comparisons test. ∗P < 0.05; ∗∗P < 0.01; ∗∗∗P < 0.001. Abbreviations as in Figure 1.
Figure 5
Figure 5
Myocardial Histological Analyses for Coronary Microvascular Dysfunction After PD Induction in Mice With or Without HFpEF (A) Representative light microscope images of left ventricular tissue after Masson’s Trichome staining for myocardial interstitial and pericapillary collagen deposition. n = 5 mice per group. The scale bar is 20 μm. Magnification ×20. (B) Bar chart representing quantitative analyses of myocardial fibrosis per high power field . n = 5 mice per group. (C) Representative confocal images of left ventricular tissue after immunofluorescent staining for the endothelial cell marker, CD31 (red). Nuclei are stained with DAPI (blue). The scale bar is 50 μm. Magnification x20. (D) Bar chart representing quantitative analyses of the number of CD31+ cells per high power field. n = 5 mice per group. (E) Representative light microscope images of left ventricular tissue after H and E staining for assessment of capillary density (arrowheads), showing decreased capillary counts in the myocardial tissue of mice with HFpEF-PD (quadrants). The scale bar is 20 μm. (F) Bar chart representing quantitative analyses of the number of capillaries per high power field. n = 5 mice per group. (B, D, and F). Data are presented as mean ± SEM. 1-way analysis of variance followed by Tukey’s multiple-comparisons test was conducted. ∗P < 0.05; ∗∗P < 0.01; ∗∗∗P < 0.001. Abbreviations as in Figure 1.
Figure 6
Figure 6
Effects of PD on Myocardial Protein Expression and Activity of Signal Pathways Involved in HFpEF Pathogenesis (A) Bar chart representing cyclic guanosine monophosphate (cGMP) quantitative analyses of myocardial tissue homogenates obtained from the different mice groups as assessed by enzyme-linked immunosorbent assay. n = 5-8 mice per group. (B) Representative western blot films. (C) Protein kinase G (PKG) expression levels normalized to actin. n = 5-9 mice per group. (D) PI3K expression levels normalized to actin. n = 6-8 mice per group. (E) p-AKT/AKT ratio. Both p-AKT and AKT were normalized to their actin separately. n = 4-10 mice per group. Data are presented as mean ± SEM. 1-way analysis of variance followed by Tukey’s multiple-comparisons test was conducted. Abbreviations as in Figure 1.
Figure 7
Figure 7
PD-Mediated Alterations in the Oral Microbiome in Mice With or Without HFpEF The α-diversity indexes, Relative Abundance, β-diversity indexes, and Linear Discriminant Analysis Effect Size (LEfSe) (Linear Discriminant Analysis [LDA]) index of the oral microbiome in the HFpEF-PD mouse model compared with control (HFpEF alone and PD alone) groups were analyzed. (A) Box plots depicting differences in the oral microbiome diversity indexes between the HFpEF-PD and control groups according to the Chao 1 index, observed species index, Fisher index, Shannon index, and Simpson index based on operational taxonomic unit (OUT) counts. (B) PCoA plots of bacterial β-diversity based on the Bray-Curtis dissimilarity (left) and weighted UniFrac distance (right). (C) The Taxa plot of the relative abundance based on the 15 top bacterial families of the oral microbiome (left) and average relative abundance in each group (right). (D) Bar plots (mean ± SEM) depicting the ratio between Firmicutes to Bacteroidetes phylum (left), the Bacteroidetes relative abundance (middle) and the Firmicutes relative abundance (right) presentences in the oral microbiome between the HFpEF-PD and control groups based on phylum level. (E) The LEfSe plot at the species level showing significantly altered composition of bacterial communities (P < 0.05 and false discovery rate on the log scale [FDR] < 2.8) with an absolute LDA score > 1.5 between the HFpEF-PD mouse model group compared with the PD group (left) and compared with the HFpEF group (right). (A) Kruskal-Wallis test followed by Dunn's multiple comparisons test. (D) 1-way analysis of variance followed by Tukey’s multiple-comparisons test. ∗P < 0.05; ∗∗P < 0.01; ∗∗∗P < 0.001. Abbreviations as in Figure 1.

References

    1. Borlaug B.A., Sharma K., Shah S.J., Ho J.E. Heart failure with preserved ejection fraction: JACC scientific statement. J Am Coll Cardiol. 2023;81:1810–1834. - PubMed
    1. Dunlay S.M., Roger V.L., Redfield M.M. Epidemiology of heart failure with preserved ejection fraction. Nat. Rev. Cardiol. 2017;14:591–602. - PubMed
    1. Shah K.S., Xu H., Matsouaka R.A., et al. Heart failure with preserved, borderline, and reduced ejection fraction: 5-year outcomes. J Am Coll Cardiol. 2017;70:2476–2486. - PubMed
    1. Mishra S., Kass D.A. Cellular and molecular pathobiology of heart failure with preserved ejection fraction. Nat Rev Cardiol. 2021;18:400–423. - PMC - PubMed
    1. Pfeffer M.A., Shah A.M., Borlaug B.A. Heart failure with preserved ejection fraction in perspective. Circ Res. 2019;124:1598–1617. - PMC - PubMed

LinkOut - more resources