. 2025 Jun;13(6):e70214.
doi: 10.1002/iid3.70214.

Arsenic Trioxide Enhances the Efficacy of PD-1 Inhibitors in Hepatocellular Carcinoma by Inducing Immunogenic Cell Death via the ROS/ERS Pathway

Affiliations

Arsenic Trioxide Enhances the Efficacy of PD-1 Inhibitors in Hepatocellular Carcinoma by Inducing Immunogenic Cell Death via the ROS/ERS Pathway

Xionghui Wang et al. Immun Inflamm Dis. 2025 Jun.

Abstract

Background: Hepatocellular carcinoma (HCC) remains a major global health challenge, with limited efficacy of current immunotherapeutic strategies. Immunogenic cell death (ICD), characterized by the release of damage-associated molecular patterns (DAMPs), offers a promising approach to enhance antitumor immunity. Arsenic trioxide (ATO), an ICD inducer, may synergize with PD-1 inhibitors to overcome therapeutic resistance, though the underlying mechanisms remain unclear.

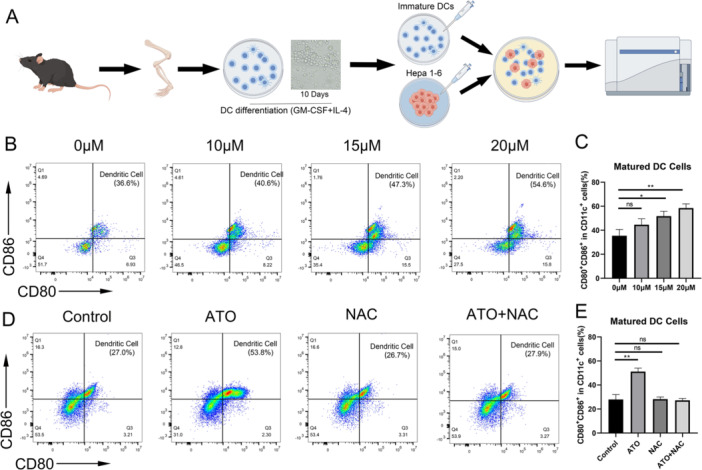
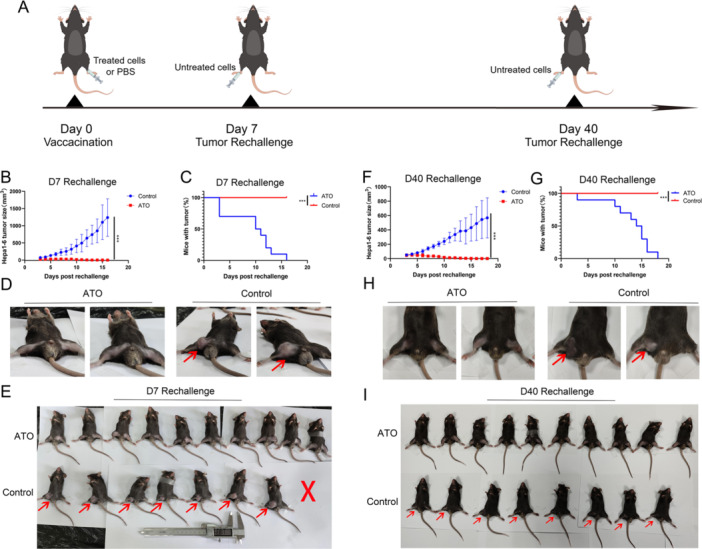
Methods: The cytotoxicity of ATO was evaluated via MTT, clonogenic, and apoptosis assays. ROS levels were quantified using ROS fluorescent probes. ERS activation was confirmed by Western blot detection of Calnexin, PDI, ATF-4, p-elF2α, and Caspase-12. ICD induction was assessed by measuring DAMPs (CRT exposure, HMGB1/ATP/IFN-β release). The roles of ROS/ERS pathways were dissected using NAC (ROS inhibitor) or 4-PBA (ERS inhibitor) pre-treatment. Ex vivo dendritic cell maturation assays analyzed ATO-treated HCC cells' immunostimulatory capacity, while In Vivo models evaluated immune microenvironment modulation via flow cytometry. Prophylactic/therapeutic tumor vaccine experiments assessed antitumor immunity using ATO-treated HCC cells as vaccines. Synergy between ATO and PD-1 blockade was tested in tumor-bearing mice by combining ATO with anti-PD-1 antibodies, monitoring tumor growth kinetics and survival outcomes.

Results: ATO dose-dependently reduced HCC cell viability while elevating intracellular ROS levels and activating ERS. These processes triggered the release/surface exposure of ICD-related DAMPs, including CRT, HMGB1, ATP, and IFN-β, leading to dendritic cells maturation and tumor immune microenvironment remodeling. ATO-treated HCC cells exhibited enhanced immunogenicity, functioning as prophylactic and therapeutic vaccines to stimulate antitumor immunity. Notably, ATO significantly potentiated the therapeutic efficacy of PD-1 inhibitors In Vivo.

Conclusion: ATO induces ICD in HCC via a ROS/ERS signaling axis, thereby amplifying antitumor immune responses and synergizing with PD-1 blockade. These findings support the clinical evaluation of ATO-PD-1 inhibitor combinations to improve outcomes in HCC patients.

Keywords: arsenic trioxide; endoplasmic reticulum stress; hepatocellular carcinoma; immunogenic cell death; oxidative stress.


Conflict of interest statement

The authors declare no conflicts of interest.

Figures

Figure 1
Figure 1
ATO enhanced the efficacy of PD‐1 inhibitors in HCC by inducing ICD via the ROS/ERS pathway.
Figure 2
Figure 2
ATO inhibited the viability of HCC cells. (A) Drug dose‐cell viability curves of Huh7 cells treated with ATO for 24, 48, and 72 h. (B) Drug dose‐cell viability curves of Hepa1‐6 cells treated with ATO for 24, 48, and 72 h. (C) Representative clonal images of Huh7 cells at various concentrations of ATO after 24 h treatment. (D) Ratio of Huh7 cells clone area to culture area (one well of a six‐well plate) (n = 3). (E) Representative clonal images of Hepa1‐6 cells at various concentrations of ATO after 24 h treatment. (F) Ratio of Hepa1‐6 cells clone area to culture area (one well of a six‐well plate) (n = 3). (G) Representative flow cytometry images of Huh7 cells at various concentrations of ATO after 24 h treatment. (H) Proportion of early apoptotic Huh7 cells and late apoptotic Huh7 cells (n = 3). (I) Representative flow cytometry images of Hepa1‐6 cells at various concentrations of ATO after 24 h treatment. (J) Proportion of early apoptotic Hepa1‐6 cells and late apoptotic Hepa1‐6 cells (n = 3). Data are presented as mean ± standard deviation. ns: no statistical significance; **p < 0.01; ***p < 0.001.
Figure 3
Figure 3
ATO triggers ROS production and ERS in HCC cells. Representative ROS‐FITC fluorescence intensity histograms (A) and bar graphs of mean fluorescence intensity (MFI) (B) of Huh7 cells treated with different concentrations of ATO for 24 h. Representative ROS‐FITC fluorescence intensity histograms (C) and bar graphs of MFI (D) of Hepa1‐6 cells treated with different concentrations of ATO for 24 h. Representative ROS‐FITC fluorescence intensity histograms (E) and bar graphs of MFI (F) of Huh7 cells treated with 20 μM ATO and/or NAC for 24 h. Representative ROS‐FITC fluorescence intensity histograms (G) and bar graphs of MFI (H) of Hepa1‐6 cells treated with 20 μM ATO and/or NAC for 24 h. Representative Western blot images of ERS‐related proteins in Huh7 cells (I). ImageJ software was used to analyze the grayscale values of Calnexin (J), PDI (K), ATF‐4 (L), p‐eIF2α (M), and Caspase 12 (N) proteins (n = 3). *p < 0.05; **p < 0.01; ***p < 0.001.
Figure 4
Figure 4
ATO induced ICD‐related DAMPs through ROS/ERS pathway. Representative CRT‐AlexaFluor488 fluorescence intensity histograms (A) and bar graphs of MFI (B) of Huh7 cells treated with ATO and/or NAC for 24 h. Representative CRT‐AlexaFluor488 fluorescence intensity histograms (C) and bar graphs of MFI (D) of Hepa1‐6 cells treated with ATO and/or NAC for 24 h. Representative CRT‐AlexaFluor488 fluorescence intensity histograms (E) and bar graphs of MFI (F) of Huh7 cells treated with ATO and/or 4‐PBA for 24 h. Representative CRT‐AlexaFluor488 fluorescence intensity histograms (G) and bar graphs of MFI (H) of Hepa1‐6 cells treated with ATO and/or 4‐PBA for 24 h. Extracellular HMGB1 levels in Huh7 cells (I) or Hepa1‐6 cells (J) after treatment with ATO and/or NAC. Extracellular HMGB1 levels in Huh7 cells (K) or Hepa1‐6 cells (L) after treatment with ATO and/or 4‐PBA. Extracellular IFN‐β levels in Huh7 cells (M) or Hepa1‐6 cells (N) after treatment with ATO and/or NAC. Extracellular IFN‐β levels in Huh7 cells (O) or Hepa1‐6 cells (P) after treatment with ATO and/or 4‐PBA. Extracellular ATP content (Q) and intracellular ATP content (R) of Huh7 cells after ATO and/or NAC treatment. Extracellular ATP content (S) and intracellular ATP content (T) of Hepa1‐6 cells after ATO and/or NAC treatment. Extracellular ATP content (U) and intracellular ATP content (V) of Huh7 cells after ATO and/or 4‐PBA treatment. Extracellular ATP content (W) and intracellular ATP content (X) of Hepa1‐6 cells after ATO and/or 4‐PBA treatment. *p < 0.05; **p < 0.01; ***p < 0.001.
Figure 5
Figure 5
The ability of HCC cells to induce DC maturation was enhanced after ATO treatment. (A) Flowchart of the experimental procedure for DC maturation assays. (B) Representative flow cytometry detection results for the concentration groups of 0, 5, 10, and 20 μM. (C) DC maturation rate (the percentage of CD80+CD86+ cells among CD11c+ cells) (n = 3). (D) Representative flow cytometry detection results for the control group, ATO group, NAC group, and ATO + NAC group. (E) DC maturation rate (the percentage of CD80+CD86+ cells among CD11c+ cells) (n = 3). Each bar represents the mean of three replicates. ns: not statistically significant, *p < 0.05, **p < 0.01.
Figure 6
Figure 6
ATO‐treated HCC cells exhibited both short‐term and long‐term anti‐HCC vaccine‐like efficacy In Vivo. (A) Flowchart of the experimental procedure for the prophylactic tumor vaccine. (B) Growth curve of tumor volumes in short‐term prophylactic tumor vaccines experiment. (C) Observation days post “D7 Rechallenge”‐ Plot of the proportion of tumor‐bearing mice. (D) Representative images captured from the inguinal regions of mice in the ATO and control groups on day 16 post “D7 Rechallenge.” (E) Images taken of all mice on Day 16 post “D7 Rechallenge,” where red arrows indicate the presence of Hepa1‐6 tumor tissue, and red “x” mark the mice that were euthanized by cervical dislocation beforehand due to tumor volumes exceeding 2000 mm³. (F) Growth curve of tumor volumes in long‐term prophylactic tumor vaccines experiment. (G) Observation days post “D40 Rechallenge”‐Plot of the proportion of tumor‐bearing mice. (H) Representative images of the inguinal region of mice from the ATO and control groups on Day 17 post “D40 Rechallenge”. (I) Images of all mice on Day 17 post “D40 Rechallenge,” where red arrows indicate the presence of Hepa1‐6 tumor tissue. ***p < 0.001.
Figure 7
Figure 7
HCC cells treated with ATO can function as a therapeutic tumor vaccine to elicit antitumor immunity. (A) Flowchart of the experimental procedure for the therapeutic tumor vaccine. (B) Growth curve of tumor volumes in the therapeutic tumor vaccine experiment. (C) Images of subcutaneous tumors from various groups. (D) Tumor weights of subcutaneous tumors from various groups. (E) Representative images of the inguinal region of mice from the ATO and control groups on Day 16 of the therapeutic tumor vaccine experiment. (F) Images of all mice on Day 16 of the therapeutic tumor vaccine experiment, where red arrows indicate the presence of Hepa1‐6 tumor tissue. ***p < 0.001.
Figure 8
Figure 8
ATO can improve the immune microenvironment of Hepa1‐6 subcutaneous tumors. (A) Average tumor volume change curves during the experiment in control and ATO groups (n = 6). (B) Images of Hepa1‐6 subcutaneous tumors. (C) Tumor weights of Hepa1‐6 subcutaneous tumors. (D) Average body weight changes in mice from both groups during the experiment. (E) Representative flow cytometry plots of CD8+ T cells in control and ATO groups. (F) Average percentage of CD8+ T cells (n = 6). (G) Representative flow cytometry plots of myeloid‐derived suppressor cells in control and ATO groups. (H) Average percentage of myeloid‐derived suppressor cells (n = 6). ns: no significant difference, *p < 0.05, **p < 0.01.
Figure 9
Figure 9
ATO enhances the anti‐HCC efficacy of PD‐1 antibodies In Vivo. (A) Average volume change curves of Hepa1‐6 subcutaneous tumors in different groups of mice during drug administration (n = 6). (B) Images of Hepa1‐6 subcutaneous tumors. (C) Weights of Hepa1‐6 subcutaneous tumors. (D) Body weight changes of mice in different groups during drug administration. (E) Volume change curves of H22 subcutaneous tumors in different groups of mice during drug administration (n = 6). (F) Survival curves of H22 subcutaneous tumor mouse models in different groups (n = 6). (G) Body weight changes of mice in different groups during drug administration. *p < 0.05, **p < 0.01.

Similar articles

References

    1. Vogel A., Meyer T., Sapisochin G., Salem R., and Saborowski A., “Hepatocellular Carcinoma,” The Lancet 400, no. 10360 (2022): 1345–1362. - PubMed
    1. Yang J. D., Hainaut P., Gores G. J., Amadou A., Plymoth A., and Roberts L. R., “A Global View of Hepatocellular Carcinoma: Trends, Risk, Prevention and Management,” Nature Reviews Gastroenterology & Hepatology 16, no. 10 (2019): 589–604. - PMC - PubMed
    1. Sun Y., Zhang W., Bi X., et al., “Systemic Therapy for Hepatocellular Carcinoma: Chinese Consensus‐Based Interdisciplinary Expert Statements,” Liver Cancer 11, no. 3 (2022): 192–208. - PMC - PubMed
    1. Yang Y., Sun J., Wu M., et al., “Chinese Expert Consensus on Immunotherapy for Hepatocellular Carcinoma (2021 Edition),” Liver Cancer 11, no. 6 (2022): 511–526. - PMC - PubMed
    1. D'Alessio A., Rimassa L., Cortellini A., and Pinato D. J., “PD‐1 Blockade for Hepatocellular Carcinoma: Current Research and Future Prospects,” Journal of Hepatocellular Carcinoma 8 (2021): 887–897. - PMC - PubMed

Publication types

MeSH terms