Unraveling the role of rat and flea population dynamics on the seasonality of plague epidemics in Madagascar
- PMID: 40504145
- PMCID: PMC12184415
- DOI: 10.1073/pnas.2502161122
Unraveling the role of rat and flea population dynamics on the seasonality of plague epidemics in Madagascar
Abstract
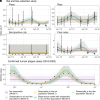
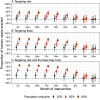
Plague continues to pose a public health problem in multiple regions of the world, including Madagascar, where it is characterized by a pronounced seasonal pattern. The drivers of plague seasonality remain poorly understood. Using a deterministic compartmental model, calibrated to rat and flea capture data, serological data collected in active rural foci, and human plague surveillance data, we analyzed the effects of seasonal rat and flea population dynamics on plague transmission. The models that incorporated seasonal fluctuations in rat and flea populations provided better predictive performances than those that did not. We found that a simpler mass-action model also performed well. Driven by these seasonal changes, the effective reproduction number (Re) between rats peaks at 1.45 [95% credible interval (CI): 1.41, 1.48] in October and falls to 0.6 (95% CI: 0.57, 0.63) in March. We estimated that 0.5% (95% CI: 0.2%, 0.9%) of rats are infected annually, indicating that plague is not the main driver of rat population changes. Using our model, we evaluated intervention strategies and found that targeting both rats and their fleas at the start of the epidemic season (July-September) was the most effective approach for reducing human plague cases. Such an approach contrasts with the reactive strategy currently employed in Madagascar. Our findings highlight the role of flea and rat populations in plague seasonality and identify strategies that could be deployed in Madagascar to better control plague epidemics.
Keywords: Madagascar; modeling; plague; public health; seasonality.
Conflict of interest statement
Competing interests statement:The authors declare no competing interest.
Figures


Similar articles
-
Bioecology of fleas with a focus on the plague vector Xenopsylla Brasiliensis in Mandritsara district, Northern Madagascar.Sci Rep. 2025 Jul 7;15(1):24297. doi: 10.1038/s41598-025-10458-4. Sci Rep. 2025. PMID: 40624118 Free PMC article.
-
Current knowledge on fleas (Siphonaptera) associated with human plague transmission in Madagascar.J Med Entomol. 2025 Jul 17;62(4):749-759. doi: 10.1093/jme/tjaf050. J Med Entomol. 2025. PMID: 40341394 Review.
-
Sertindole for schizophrenia.Cochrane Database Syst Rev. 2005 Jul 20;2005(3):CD001715. doi: 10.1002/14651858.CD001715.pub2. Cochrane Database Syst Rev. 2005. PMID: 16034864 Free PMC article.
-
Systemic pharmacological treatments for chronic plaque psoriasis: a network meta-analysis.Cochrane Database Syst Rev. 2021 Apr 19;4(4):CD011535. doi: 10.1002/14651858.CD011535.pub4. Cochrane Database Syst Rev. 2021. Update in: Cochrane Database Syst Rev. 2022 May 23;5:CD011535. doi: 10.1002/14651858.CD011535.pub5. PMID: 33871055 Free PMC article. Updated.
-
Smoking cessation medicines and e-cigarettes: a systematic review, network meta-analysis and cost-effectiveness analysis.Health Technol Assess. 2021 Oct;25(59):1-224. doi: 10.3310/hta25590. Health Technol Assess. 2021. PMID: 34668482
References
-
- Bertherat E., Plague around the world in 2019 – La peste dans le monde en 2019. W. Epidemiol. Rec. 94, 289–292 (2019).
-
- Mahmoudi A., et al. , Plague reservoir species throughout the world. Integr. Zool. 16, 820–833 (2021). - PubMed
-
- Brygoo E. R., Epidemiologie de la peste à Madagascar. Arch. Inst. Pasteur Madagascar. 35, 9–147 (1966).
-
- Chanteau S., Atlas de la peste à Madagascar (IRD Editions, 2006).
MeSH terms
Grants and funding
LinkOut - more resources
Full Text Sources
Medical

