. 2025 Jun 12;16(1):5303.
doi: 10.1038/s41467-025-60421-0.

A macrophage-predominant immunosuppressive microenvironment and therapeutic vulnerabilities in advanced salivary gland cancer

Affiliations

A macrophage-predominant immunosuppressive microenvironment and therapeutic vulnerabilities in advanced salivary gland cancer

Erika Zuljan et al. Nat Commun. .

Abstract

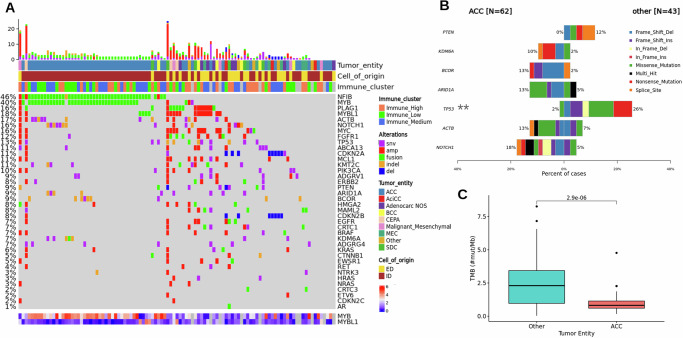
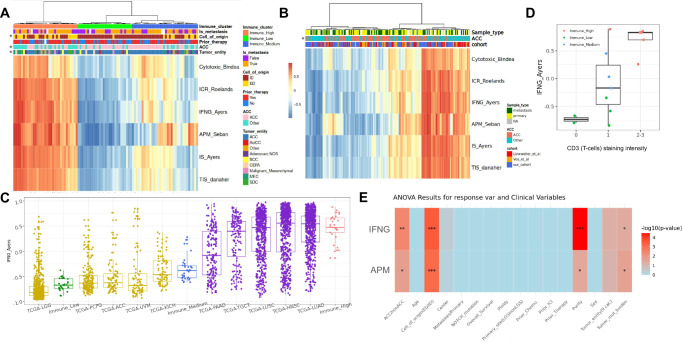
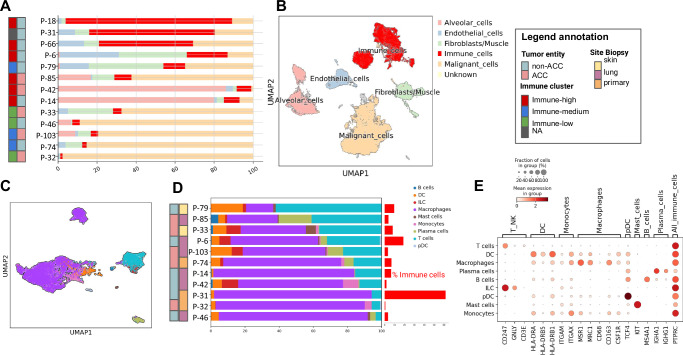
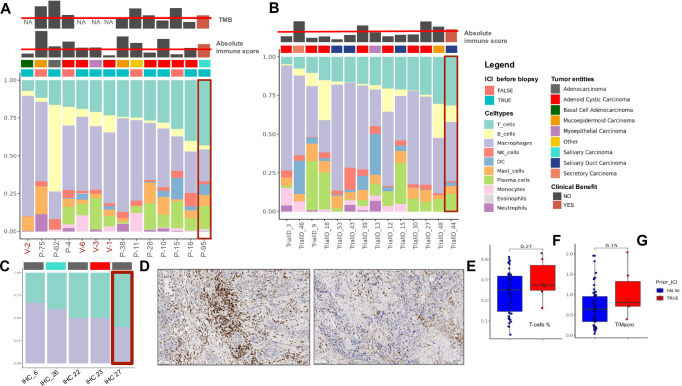
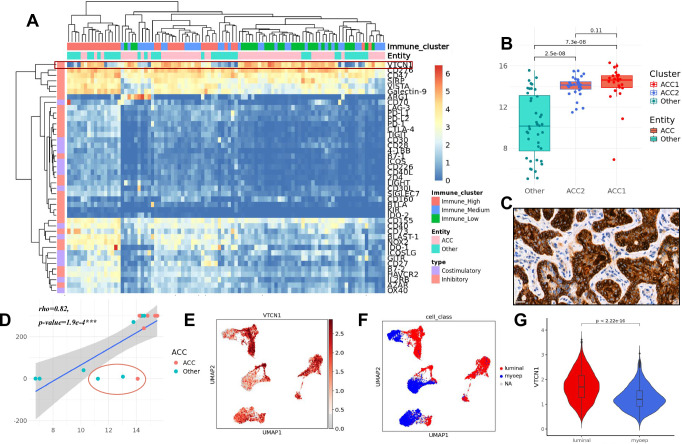
Salivary gland cancers are rare, diverse malignancies characterized by poor response to immunotherapy. The tumor immune environment in these cancers remains poorly understood. To address this, we perform an integrative analysis of the tumor immune microenvironment in a large cohort of advanced salivary gland cancer samples. Most tumors exhibit low immune activity with limited immune cell infiltration. Inflammation is linked to higher tumor mutational burden in non-adenoid cystic carcinoma histologies. Subtype specific expression of immune checkpoints is identified with prominent expression of VTCN1 in luminal-like cells within adenoid cystic carcinoma. Macrophages with immunosuppressive properties dominate the immune microenvironment across subtypes. Responses to immunotherapy are limited and associated with a higher ratio of T-cells relative to macrophages in individual cases, warranting further investigation. Here, we show an immunosuppressive environment in salivary gland cancers and identify subtype-specific immune vulnerabilities that could inform tailored therapeutic strategies.


Conflict of interest statement

Competing interests: C.H. received honoraria, research funding and/or consulting/advisory board from Roche, Novartis, and Boehringer Ingelheim. S.F. reports consultancy fees from Illumina, DTR has received honoraria, research support, and/or travel/accommodation expenses from Bayer, Eli Lilly, Bristol-Myers Squibb, Roche, BeiGene, J&J, and Seagen. The remaining authors report no competing interests.

Figures

Fig. 1
Fig. 1. Study cohort and data.
A Clinical characteristics of the cohort, including tumor entities, therapy status (therapy prior to sequencing), site of biopsy, age and sex are presented. B Availability of sequencing data and number of samples (do not equal to number of patients on the left), as well as overlapping data availability, is provided. RNA-seq data were evaluable for a majority of patients (n = 93, n_samples 95). (ACC Adenoid Cystic Carcinoma, ADC Adenocarcinoma, BCC Basal Cell Carcinoma, MEC Mucoepidermoid Carcinoma, SDC Salivary Duct Carcinoma, LSG Large Salivary Glands, WGS Whole Genome Sequencing, WES Whole Exome Sequencing). Figure created using the Mind the Graph platform (www.mindthegraph.com).
Fig. 2
Fig. 2. Summary of molecular alterations.
A Oncoprint with molecular alterations in a set of selected genes commonly affected in SGC (n = 104). On the left, the percentage of samples with one or more alterations in each listed gene is shown. The top bar shows the total number of alterations in the specific sample. The heatmap at the bottom represents the expression of MYB and MYBL1 genes. B Co-barplot with most common SNVs in ACC and non-ACC. TP53 alterations are the only SNVs significantly enriched in non-ACC. C Tumor mutational burden was significantly higher in non-ACC (n = 43, median = 2.3, iqr = 2.5, max = 8.3, min = 0.03) compared to ACC samples (n = 60, median = 0.82, iqr = 0.54, max = 4.7, min = 0.17) (Wilcoxon test, two-sided).
Fig. 3
Fig. 3. Advanced SGC cluster into 3 groups of immune infiltration.
A Heatmap of GSVA scores of 6 immune signatures (see methods) for all samples (n = 95). Samples were clustered by hierarchical clustering and annotated by tumor entity (ACC/non-ACC or 9 categories of tumor entities), cell-of-origin group (ID/ED), sample type (metastasis/primary) and prior systemic therapy status. B GSVA scores of 6 immune signatures were calculated in an integrated analysis together with previously published cohorts (n = 198). Samples were annotated by tumor entity (ACC/non-ACC), sample type (metastasis/primary) and cohort (MASTER cohort/Linxweiler et al/Vos et al). C Comparison of immune clusters (Immune-high n = 33 median = 0.48, iqr = 0.29, max = 0.88, min = −0.13; Immune-medium n = 34 median = −0.38, iqr = 0.24, max = 0.28, min = −0.62; Immune-low n = 28 median = −0.67, iqr=0.19, max = −0.38, min = −0.89) to TCGA most (PAAD n = 183 median = −0.08, iqr = 0.87, max = 0.94, min = −0.83; TGCT n = 156 median = 0.40, iqr = 0.69, max = 0.88, min = −0.76; LUSC n = 553 median = 0.47, iqr = 0.68, max = 0.97, min = −0.91; HNSC n = 566 median = 0.56, iqr = 0.79, max = 0.98, min = −0.87; LUAD n = 600 median = 0.55, iqr = 0.52, max = 0.97, min = −0.80) and least inflamed cohorts (LGG n = 534 median = −0.82, iqr = 0.18, max = 0.69, min = −0.96; PCPG n = 187 median = −0.63, iqr = 0.24, max = 0.62, min = −0.88; ACC n = 79 median = −0.63, iqr = 0.28, max = 0.77, min = −0.84; UVM n = 80 median = −0.68, iqr = 0.34, max = 0.85, min = −0.93; KICH n = 91 median = −0.47, iqr = 0.41, max = 0.38, min = −0.79). D Intensity of pan T-cell marker (CD3) versus IFNG bulk score. Samples were colored by immune clusters (n = 14, Immune-high n = 6 median=0.83, iqr=0.13, max=0.85, min=0.26; Immune-medium n = 3 median = −0.17, iqr=0.71, max=0.89, min = −0.84; Immune-low n = 5 median = −0.73, iqr=0.06, max = −0.67, min = −0.80). E One-way anova test was performed to analyze the association of several clinical parameters with immune scores (APM and IFNG). Corrected and log-transformed p-values are provided in the heatmap, showing a significant impact of tumor entity, cell-of-origin, tumor purity, and TMB.
Fig. 4
Fig. 4. TIM composition analysis based on single nuclei data.
A Proportions of major cell-types in single nuclei data revealed a higher number of immune cells (red) in tumors previously classified as immune-high (legend is provided in panel B). Samples are annotated by tumor entity and bulk-based immune cluster (see legend annotation). P-31 did not have evaluable bulk data and therefore lacked immune cluster annotation. B UMAP plot of integrated data, annotated by major cell types. C UMAP of immune cells (n = 11, after exclusion of lymph node metastasis samples) annotated by major immune cell populations. D Proportions of immune cell populations in single nuclei data revealed a predominance of macrophages (legend is provided in panel D). Samples were annotated by tumor entity and biopsy site (see legend annotation). The bars on the right represent the proportion of immune cells in the sample. E Expression of selected immune cell markers in annotated immune cells.
Fig. 5
Fig. 5. Macrophages dominate TIM in advanced SGC.
A Deconvolution results for 61 samples with evaluable results. Barplot shows the proportions of major immune cell subpopulations. Samples were ordered by T-cell to macrophage ratio and annotated by tumor entity, cell of origin (ID/ED group), and immune cluster. B Deconvolution results revealed significantly different proportions of CD8 T-cells between previously identified immune subgroups (p-value filtered, Immune-high n = 24 median = 0.11, iqr = 0.08, max = 0.24, min = 0.03; Immune-medium n = 25 median = 0.07, iqr = 0.06, max = 0.23, min = 0.00; Immune-low n = 12 median = 0.05, iqr = 0.03, max = 0.08, min = 0.00) (Wilcoxon test, two-sided). C, D In an integrated analysis including previously published studies, the overall T-cell/Macrophage ratio did not differ between ACC (n = 47, median = 0.72, iqr = 0.59, max = 1.96, min = 0.04) and non-ACC (n = 51, median = 0.73, iqr = 0.61, max = 3.52, min = 0.10) samples (C), whereas a higher M2-macrophage/overall macrophage ratio was observed in ACC (n = 47, median = 0.86, iqr = 0.20, max = 1.00, min = 0.28) compared to non-ACC (n = 51, median = 0.64, iqr = 0.29, max = 0.95, min = 0.24) samples (D) (integrated, p-value and TNM filtered data, n = 98) (Wilcoxon test, two-sided). E A low T-cell/macrophage ratio was confirmed across different analytic modalities including bulk sequencing (n = 61, median = 0.68, iqr = 0.58, max = 2.04, min = 0.04), single-cell sequencing (n = 11, median = 0.75, iqr = 1.19, max = 5.72, min = 0.04), and immunohistochemistry (n = 40, median = 0.83, iqr = 0.50, max = 3.00, min = 0.00) (Wilcoxon test, two-sided). F Representative H&E staining of a tumor sample (ACC). Highlighted in blue is the invasive tumor front. G Same sample as in panel F showing the presence of macrophages (CD68 staining) (Same scale as figure F). H Same sample as in panel F and G showing the presence of CD8 T cells (Same scale as figure F and G). I Representative image of M2-macrophages clustering towards the tumor edge in the tumor immune microenvironment in a SGC samples. M2-like macrophages (CD163) are highlighted by yellow, whereas the red line shows the tumor front. J Survival plot of the samples with the highest and lowest T-cell proportion (upper- and lower quartile of deconvoluted T-cell proportions) shows a nonsignificant trend towards improved survival with higher T-cell proportions (log-rank test, two-sided).
Fig. 6
Fig. 6. Clinical benefit in individual patients with high T-cell infiltration.
A Deconvolution results for 14 samples of patients treated with immune checkpoint inhibitors from the MASTER cohort, also including additionally integrated data from a validation cohort of 4 patients (red font). Barplot shows proportions of major immune cell subpopulations. Samples were ordered by T-cell to macrophage ratio and annotated by tumor entity and therapy status (ICI prior to sequencing). Top bars indicate the absolute immune score and TMB. The red lines depict median scores. Patients achieving a clinical benefit were marked in red. B Deconvolution results for 14 samples from the Vos et al pre-treatment cohort. For details see panel A. TMB results were missing for this cohort. C Additional validation in a separate cohort of 5 patients treated with ICI using immunohistochemistry. Staining intensities of CD68 and CD3 were normalized to sum up to 1. Samples were annotated by tumor entity and sorted by T-cell proportions. Clinical benefit was observed in the patient with the highest T-cell/macrophage ratio (highlighted in red). D Immunohistochemical CD3 staining revealed the presence of T-cells in the patient achieving a clinical benefit from C. E Immunohistochemical CD68 staining depicting some presence of macrophages in the same patient. Deconvoluted, p-value filtered T-cell proportions (F) and T-cell to macrophage ratios (G) in samples that received ICI prior to sequencing (n = 6, median T-cell proportion = 0.28, iqr = 0.12, max = 0.43, min = 0.16; T-cell/macrophage ratio = 0.81, iqr = 0.61, max = 2.04, min = 0.39) or did not receive ICI before sequencing (n = 54, median T-cell proportion = 0.25, iqr = 0.17, max = 0.41, min = 0.03; T-cell/macrophage ratio = 0.65, iqr = 0.62, max = 1.96, min = 0.04) revealed no significant changes in tumor immune microenvironment composition after ICI treatment, although a modest increase in T-cell levels was observed (Wilcoxon test, two-sided).
Fig. 7
Fig. 7. Analysis of biomarkers for immunotherapy.
A Expression matrix based on log TPM values of selected immune checkpoints. The checkpoints were annotated on the left as co-inhibitory or co-stimulatory. The samples were annotated based on the tumor entity and the immune-cluster assignment. VTCN1 was highlighted in red. B Boxplot of VTCN1 expression (here vst values) in ACC1 (n = 25, median = 14.60, iqr = 1.16, max = 16.3, min = 6.19), ACC2 (n = 32, median = 14.10, iqr = 0.75, max = 15.5, min = 11.5), and non-ACC (n = 38, median = 9.92, iqr = 6.06, max = 14.9, min = 0.71) showing significantly increased VTCN1 expression in ACC compared to non-ACC samples and a nonsignificant trend towards increased VTCN1 expression in ACC1 (Wilcoxon test, two-sided). C: Exemplary staining of VTCN1 in an ACC sample reveals strong staining intensity on tumor cells. D: VTCN1 expression by RNAseq was significantly correlated with VTCN1 staining intensity by IHC (intensity * percentage positive cells), with the exception of 3 outliers (highlighted in red). The shaded area represents the 95% confidence interval of the linear model. E: Expression of VTCN1 in ACC malignant cells. UMAP shows non-integrated data. Cells are clustered by donor. F: UMAP of malignant cells in ACC colored by assigned cell type (myoepithelial- or luminal-like) revealed an association between VTCN1 expression and cell type. G: Violin plot with expression of VTCN1 in myoepithelial- vs. luminal-like malignant cells showed significantly higher expression in luminal ACC cells (luminal: n = 2615, median = 1.70, iqr = 0.88, max = 3.61, min = 0.38; myoepithelial: n = 1033, median = 1.20, iqr = 0.63, max = 3.05, min = 0.26). Cells expressing no VTCN1 were removed (Wilcoxon test, two-sided).

References

    1. Skálová, A., Hyrcza, M. D. & Leivo, I. Update from the 5th Edition of the World Health Organization Classification of Head and Neck Tumors: Salivary Glands. Head. Neck Pathol.16, 40–53 (2022). - PMC - PubMed
    1. Nam, S. J. et al. Risk factors and survival associated with distant metastasis in patients with carcinoma of the salivary gland. Ann. Surg. Oncol.23, 4376–4383 (2016). - PubMed
    1. Dillon, P. M., Chakraborty, S., Moskaluk, C. A., Joshi, P. J. & Thomas, C. Y. Adenoid cystic carcinoma: A review of recent advances, molecular targets, and clinical trials. Head. Neck38, 620–627 (2016). - PMC - PubMed
    1. Ferrarotto, R. et al. Proteogenomic analysis of salivary adenoid cystic carcinomas defines molecular subtypes and identifies therapeutic targets. Clin. Cancer Res.27, 852–864 (2023). - PMC - PubMed
    1. Van Herpen, C. et al. Salivary gland cancer: ESMO–European Reference Network on Rare Adult Solid Cancers (EURACAN) Clinical Practice Guideline for diagnosis, treatment and follow-up. ESMO Open7, 100602 (2022). - PMC - PubMed

MeSH terms