. 2025 Jun 12;13(1):61.
doi: 10.1038/s41413-025-00430-3.

Synovial fibroblast derived small extracellular vesicles miRNA15-29148 promotes articular chondrocyte apoptosis in rheumatoid arthritis

Affiliations

Synovial fibroblast derived small extracellular vesicles miRNA15-29148 promotes articular chondrocyte apoptosis in rheumatoid arthritis

Zhenyu Zhang et al. Bone Res. .

Erratum in

Abstract

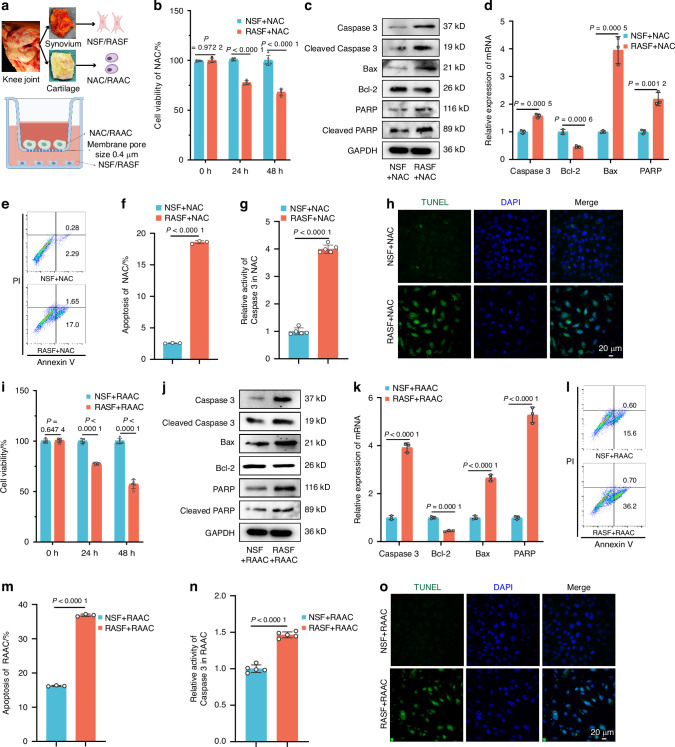
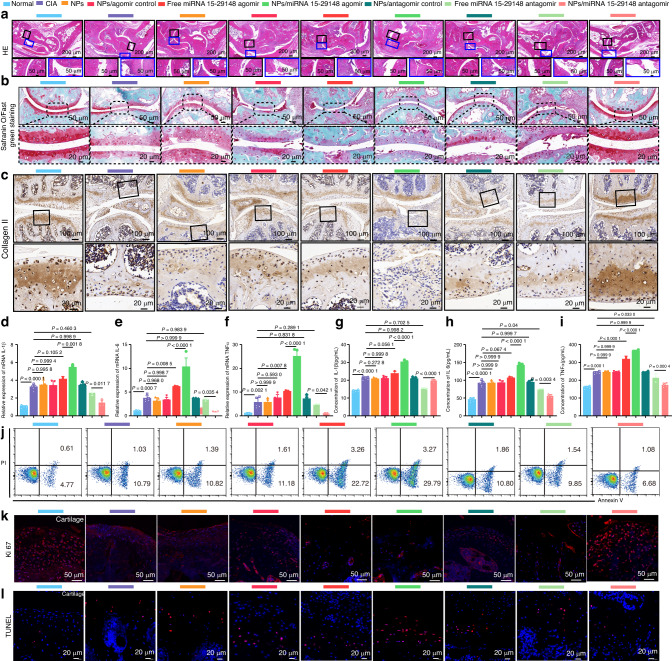
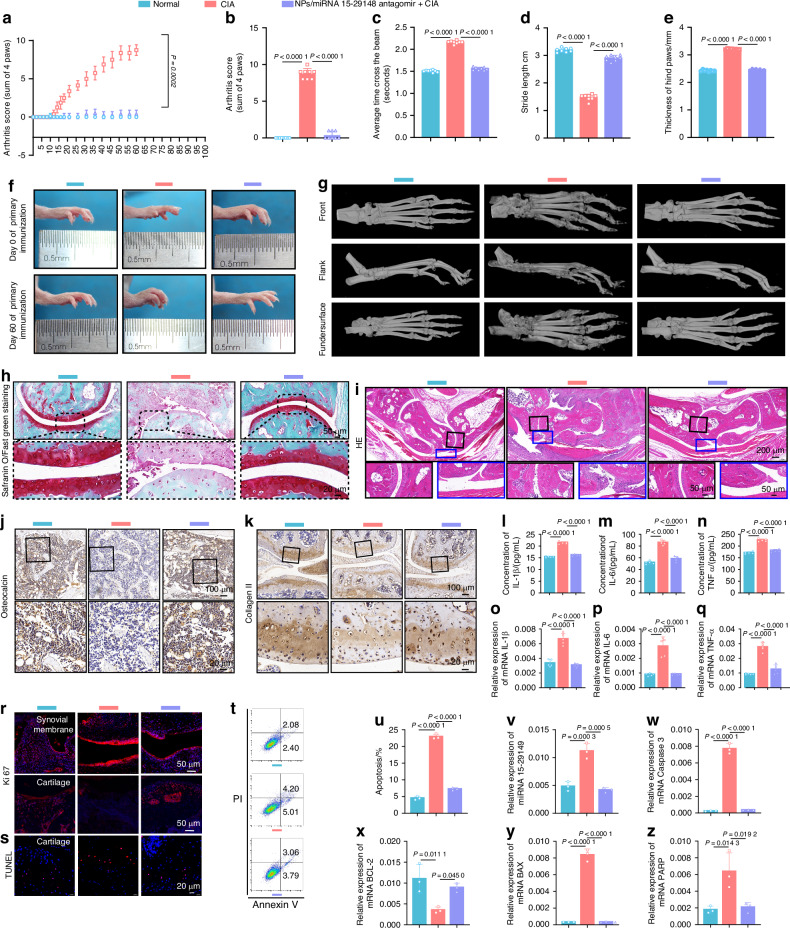
Rheumatoid arthritis (RA) is a systemic autoimmune disease in which synovial fibroblasts (SFs) maintain chronic inflammation by secreting proinflammatory mediators, leading to joint destruction. While the role of proinflammatory mediators in this process is well-established, the contribution of non-inflammatory regulators in SFs to joint pathology remains poorly understood. In this study, we investigated the non-inflammatory role of SFs in RA using a co-culture model, and found that SFs from RA patients promote apoptosis of human chondrocytes. Mechanistic investigations reveal that SFs can secrete small extracellular vesicles (sEVs), which are taken up by chondrocytes and induce chondrocyte apoptosis in both normal chondrocytes and chondrocytes from patients with RA. sEV-derived miRNA 15-29148 are identified as key signaling molecules mediating the apoptosis effects of chondrocytes. Further studies reveal that SF-derived miRNA 15-29148 targeting CIAPIN1 results in increased chondrocyte apoptosis. We further demonstrate that SF-derived miRNA 15-29148 is transferred to chondrocytes, exacerbating cartilage damage in vivo. Moreover, chondrocyte-specific aptamer-modified polyamidoamine nanoparticles not only ameliorated RA but also prevented its onset. This study suggests that, in RA, the secretion of specific sEV-miRNAs from SFs plays a crucial role in promoting chondrocyte apoptosis, potentially through non-inflammatory regulation, and that sEV-miRNA inhibition in SFs may represent an early preventive treatment strategy for cartilage degradation in RA.


Conflict of interest statement

Competing interests: The authors declare no competing interests.

Figures

Fig. 1
Fig. 1
Synovial Fibroblasts from RA Patients Promote AC Apoptosis. a Strategy for co-culture of human primary synovial fibroblasts and human primary chondrocytes. b, i Cell viability of NAC and RAAC co-cultured with NSF or RASF was analyzed using CCK8 over different time periods (n = 5). c, j Western blot analysis detected the expression levels of apoptosis-related proteins in NAC and RAAC after 48 h of co-culture with NSF/RASF (n = 3). d, k RT-qPCR was used to determine the expression levels of apoptosis-related genes in NAC and RAAC (n = 3). e, f, l, m Apoptosis analysis of NAC and RAAC was performed using flow cytometry with Annexin V-FITC/PI staining (n = 5). g, n Caspase-3 activity in NAC and RAAC co-cultured with NSF or RASF for 48 h was measured (n = 5). h, o TUNEL staining of NAC and RAAC co-cultured with NSF or RASF for 48 h was performed. (b, d, f, g, i, kn) Data are presented as mean ± SD. Student’s t-test was used to calculate P-values between NSF and RASF
Fig. 2
Fig. 2
RASF Promotes Apoptosis of AC by Secreting sEVs. a Flowchart depicting the sEVs purification procedure via differential ultracentrifugation. b Western blot analysis of CD9, CD63, Flotillin 1, Calnexin, and β-actin expression levels in NSF/RASF sEVs (n = 3). c Transmission electron microscopy (TEM) images of sEVs purified from NSF or RASF. d Nanoparticle tracking analysis of the size distribution of NSF/RASF sEVs. e NSF/RASF sEVs stained with PKH26 red membrane dye. f, m CCK8 assay of cell viability of NAC and RAAC treated with NSF/RASF sEVs over different time periods (n = 5). g, n Western blot analysis detected the expression levels of apoptosis-related proteins in NAC and RAAC treated with NSF/RASF sEV for 48 h (n = 3). h, o The expression levels of apoptosis-related genes in NAC and RAAC (n = 3). i, j, p, q Apoptosis analysis of NAC and RAAC using flow cytometry with Annexin V-FITC/PI staining (n = 3). k, r Caspase-3 activity in NAC and RAAC after 48 h of culture with NSF or RASF sEVs (n = 5). l, s TUNEL staining of NAC and RAAC cultured with NSF or RASF sEVs for 48 h. (f, h, j, k, m, o, q, r) Data are presented as mean ± SD. Student’s t-test was used to calculate p-values between NSF and RASF sEV treatments
Fig. 3
Fig. 3
miRNA 15-29148 in SEV Secreted by RASF Promotes Apoptosis of AC. a Heat map depicting the top 50 differentially expressed miRNAs in RASF sEV. b Volcano plot of miRNA expression level differences between RA patients and controls in sEV. c, d miRNA 15-29148 expression levels in human primary synovial fibroblasts and their secreted sEVs. eg miRNA 15-29148 expression levels in synovial tissues synovial fluid cartilage of RA patients or controls. (cg) All bar graphs are presented as the mean ± SD. by Student’s t-test. hj Sensitivity and specificity of the ROC curve in assessing the prediction of RA by miRNA 15-29148 expression level in synovial tissue, joint fluid and cartilage tissue. k FISH analysis of RA cartilage tissues levels of miRNA 15-29148. l, r CCK8 analysis of NAC and RAAC cell viability (n = 5). m, t Western blot analysis detected the expression levels of apoptosis-related proteins in NCR and RAAC (n = 3). n, u The expression levels of apoptosis-related genes in NAC and RAAC (n = 3). o, s Apoptosis analysis of NAC and RAAC using flow cytometry with Annexin V-FITC/PI staining (n = 3). p, v Caspase-3 activity in NAC and RAAC (n = 5). q, w TUNEL staining of NAC and RAAC. (l, np, r, s, u, v) Data are presented as mean ± SD. One-way ANOVA was used to calculate P-values
Fig. 4
Fig. 4
CIAPIN 1, the Target of miRNA 15-29148, is Downregulated in RA. a Target genes of miRNA 15-29148 predicted using miRanda, RNAhybrid, and apoptosis databases. b Schematic representation of putative miRNA 15-29148 binding sites on the 3’ UTR of CIAPIN 1 in humans. c Human primary chondrocytes transfected with wild-type or mutated CIAPIN 1 3’ UTR luciferase constructs and control mimic or miRNA 15-29148 mimics. d mRNA CIAPIN 1 expression levels downregulated in RA patients (n = 30) compared with controls (n = 18). Data are presented as mean value ± SD (n = 3). Student’s t-test was used to calculate P values between Normal and RA groups. e Spearman’s correlation coefficient analysis between miRNA 15-29148 levels in cartilage and CIAPIN 1 mRNA levels in cartilage from patients. f Immunofluorescence staining of CIAPIN 1 in cartilage tissue. Nucleus, blue (DAPI); CIAPIN 1, green. Scale: 50 μm. Representative images of three biologically independent samples in each group. g Western blot analysis of CIAPIN 1 expression levels in NAC and RAAC (n = 3). h, i Gene and protein levels of CIAPIN 1 after transfection with miRNA 15-29148 mimics. j, k Gene and protein levels of CIAPIN 1 after transfection with miRNA 15-29148 inhibitor. l, m Gene and protein levels of CIAPIN 1 after transfection with miRNA 15-29148 mimics and CIAPIN 1 overexpression constructs. n, o Gene and protein levels of CIAPIN 1 after transfection with miRNA 15-29148 inhibitor and SI-CIAPIN 1 inhibitor. (n = 3). (h, j, l, n) Data are presented as mean ± SD. One-way ANOVA was used to calculate P-values. p, q Expression of CIAPIN 1 in arthritic joints detected by immunohistochemistry. Representative images of three biologically independent samples in each group
Fig. 5
Fig. 5
CIAPIN 1 Promotes Apoptosis of Human Primary Chondrocytes. a, g, m, r Cell viability was measured using CCK8 at 0, 24 and 48 h (n = 5). b, h, n, s Western blot analysis detected the expression levels of apoptosis-related proteins. c, i, o, u the expression levels of apoptosis-related genes (n = 3). d, j, p, v Apoptosis was analyzed using flow cytometry with Annexin V-FITC/PI staining (n = 3). e, k, q, w Caspase-3 activity (n = 5). f, l, t, x TUNEL staining of RAAC was performed. a, c, e, g, i, k, n, o, q, r, u, w Data are presented as mean value ± SD. One-way ANOVA was used to calculate P values
Fig. 6
Fig. 6
Bone Function and Mobility Analysis of CIA Mice after tgg2-PEG2000-PAMAM6.0-Cy5.5/miRNA 15-29148 Antagomir Delivery. a Schematic representation of tgg2-PEG2000-PAMAM6.0-Cy5.5 synthesis. b ^1H NMR spectrum of nanoparticles (NPs). c Electrophoretic mobility analysis of miRNA in agarose gel. d TEM image and NTA results of the NPs/miRNA at a 16:1 weight ratio. e In vitro viability of chondrocytes (n = 5). f, g Relative mRNA expression of miRNA 15-29148 in NAC and RAAC (n = 3). h Zeta potential changes of the resulting nanocomplexes monitored under different mixtures. i nanoparticles vivo biodistribution in mice. j, k Representative images in NAC after 2, 4 and 8 h of transfection with PEG-PAMAM-Cy5.5 or tgg2-PEG-PAMAM-Cy5.5. l Evaluation of claw clinical indicators (n = 8). m Clinical indexes of the anterior and posterior paws (n = 8). n Beam walking test. o Step length measured by hind paw distance. p Hind paw thickness (n = 8). q Severity of soft tissue swelling and bone erosion in the paws of mice evaluated by macroscopic observation. r Representative microCT images of a mouse foot paw. eh, mp Data are presented as mean ± SD. One-way analysis of variance and LSD test were used for statistical analysis
Fig. 7
Fig. 7
tgg2-PEG2000-PAMAM6.0-Cy5.5/miRNA 15-29148 Antagomir Nanoparticles Reverse Cartilage Damage, Bone Erosion, and Inflammation Levels in CIA Mice. a Histological changes in the ankle joint analyzed by H&E staining. b Articular cartilage of the ankle identified by Safranin O/Fast Green staining. c Expression of Collagen II in arthritic joints detected by immunohistochemistry. df Relative mRNA expression levels of IL1β, IL6 and TNF-α in knee tissue detected by RT-qPCR after 8 weeks of administration. gi Serum concentrations of proinflammatory cytokines (IL1β, IL6, TNF-α) measured by ELISA after 8 weeks of administration. di Data are expressed as mean ± SD (n = 5). One-way analysis of variance and LSD test were used for statistical analysis. j Apoptosis analysis of CIA mouse chondrocytes after 8 weeks of administration using flow cytometry based on Annexin V-FITC/PI staining (n = 3). k, l Anti-proliferation and anti-apoptosis effects of NPs/miRNA 15-29148 antagomir nanoparticles on the synovial tissue or cartilage tissue of CIA mice observed by TUNEL and Ki67 immunofluorescence staining
Fig. 8
Fig. 8
tgg2-PEG2000-PAMAM6.0-Cy5.5/miRNA 15-29148 Antagomir Can Prevent the Occurrence of Arthritis in Mice. a Changes in clinical scores within 60 days of initial immunization. (n = 8). b clinical scores of CIA mice. (n = 8). c Beam walking test in CIA mice, with the time to cross the 72 cm beam recorded. d Step length measured by hind paw distance. e Hind paw thickness. (n = 8). f Severity of soft tissue swelling and bone erosion in the paws of mice evaluated by macroscopic observation. g Representative microCT images of a mouse foot paw. h Articular cartilage of the ankle identified by Safranin O/Fast Green staining. i Histological changes in the ankle joint analyzed by H&E staining. j, k Expression of Osteocalcin and Collagen II in arthritic joints detected by immunohistochemistry. l–n Serum concentrations of proinflammatory cytokines (IL1β, IL6, TNF-α) measured by ELISA after 60 days of initial immunization. oq Relative mRNA expression levels of IL1β, IL6, and TNF-α in knee tissue (n = 5). s, r Proliferation and apoptosis effects of NPs/miRNA 15-29148 antagomir nanoparticles on the synovial tissue or cartilage tissue of CIA mice observed by TUNEL and Ki67 immunofluorescence staining. t, u CIA mouse chondrocyte apoptosis analysis using flow cytometry based on Annexin V-FITC/PI staining (n = 3). v–z Relative mRNA expression of miRNA 15-29148 in cartilage. Relative mRNA expression of Caspase-3, BCL-2, BAX, and PARP in cartilage measured by RT-qPCR (n = 3). ae, lq, uz Data are presented as mean ± SD. One-way analysis of variance and LSD test were used for statistical analysis

References

    1. Gravallese, E. M. et al. What is rheumatoid arthritis? N. Engl. J. Med.390, e32 (2024). - PubMed
    1. Smith, M. H. & Berman, J. R. What is rheumatoid arthritis? JAMA327, 1194 (2022). - PubMed
    1. Li, T. et al. Pathogenic antibody response to glucose-6-phosphate isomerase targets a modified epitope uniquely exposed on joint cartilage. Ann. Rheum. Dis.82, 799–808 (2023). - PubMed
    1. Vyawahare, A. et al. Caffeic acid modified nanomicelles inhibit articular cartilage deterioration and reduce disease severity in experimental inflammatory arthritis. ACS Nano16, 18579–18591 (2022). - PubMed
    1. Guo, D. et al. FABP4 secreted by M1-polarized macrophages promotes synovitis and angiogenesis to exacerbate rheumatoid arthritis. Bone Res.10, 45 (2022). - PMC - PubMed

MeSH terms

LinkOut - more resources