. 2025 Aug;44(15):4252-4279.
doi: 10.1038/s44318-025-00483-4. Epub 2025 Jun 12.

Phosphoribosyl ubiquitination of SNARE proteins regulates autophagy during Legionella infection

Affiliations

Phosphoribosyl ubiquitination of SNARE proteins regulates autophagy during Legionella infection

Rukmini Mukherjee et al. EMBO J. 2025 Aug.

Abstract

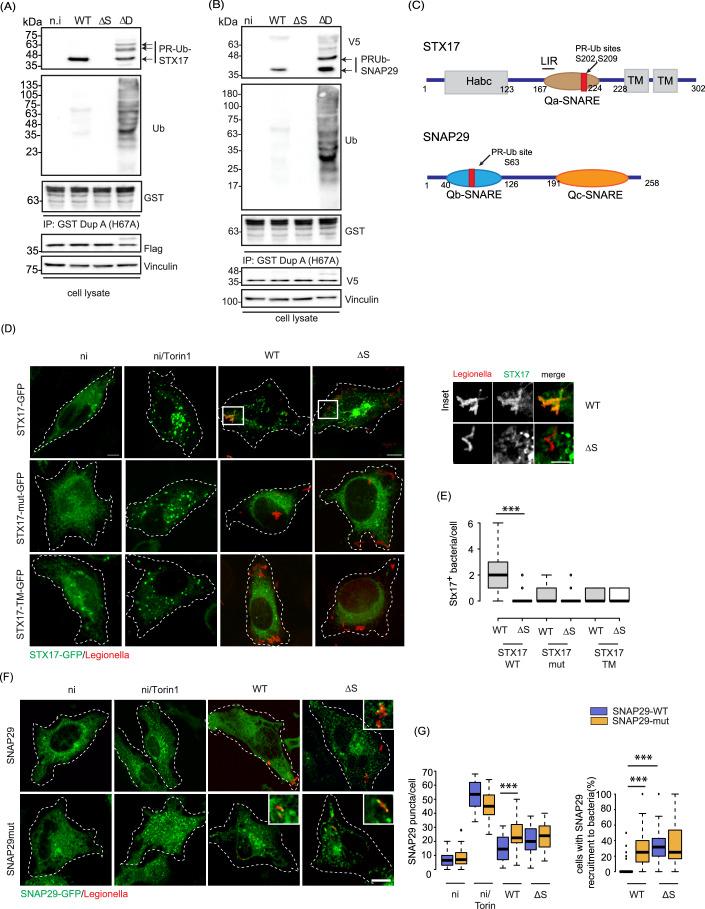
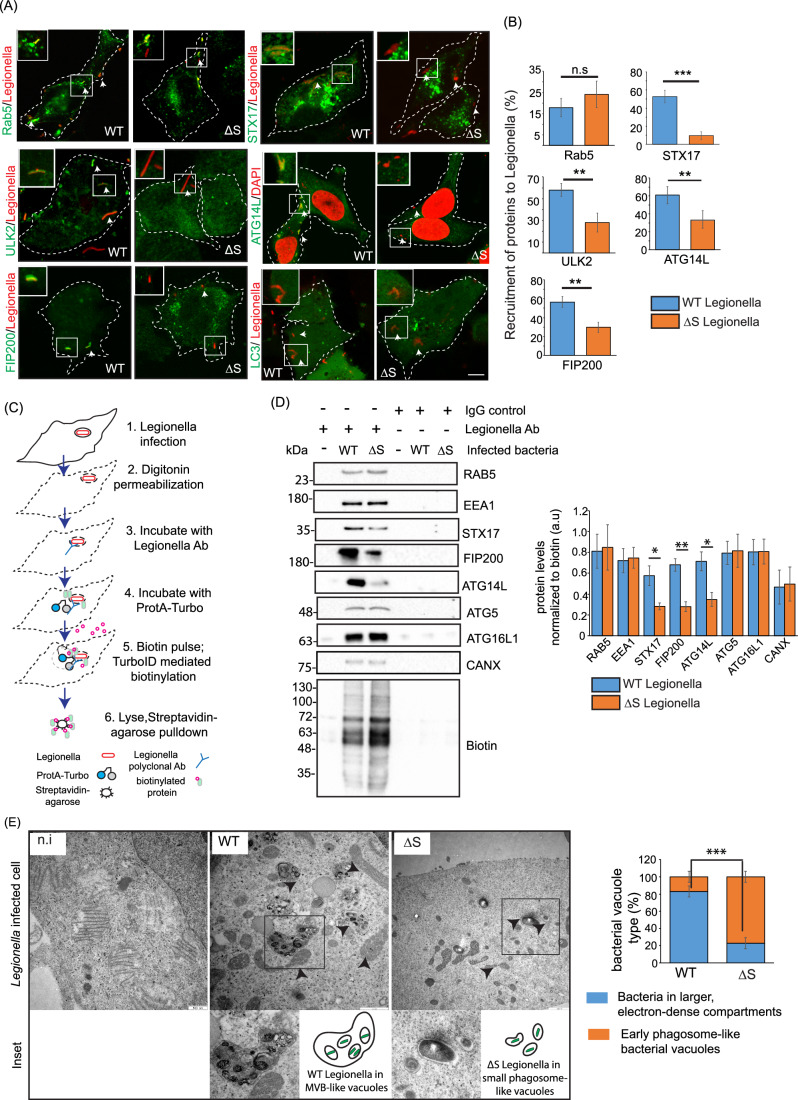
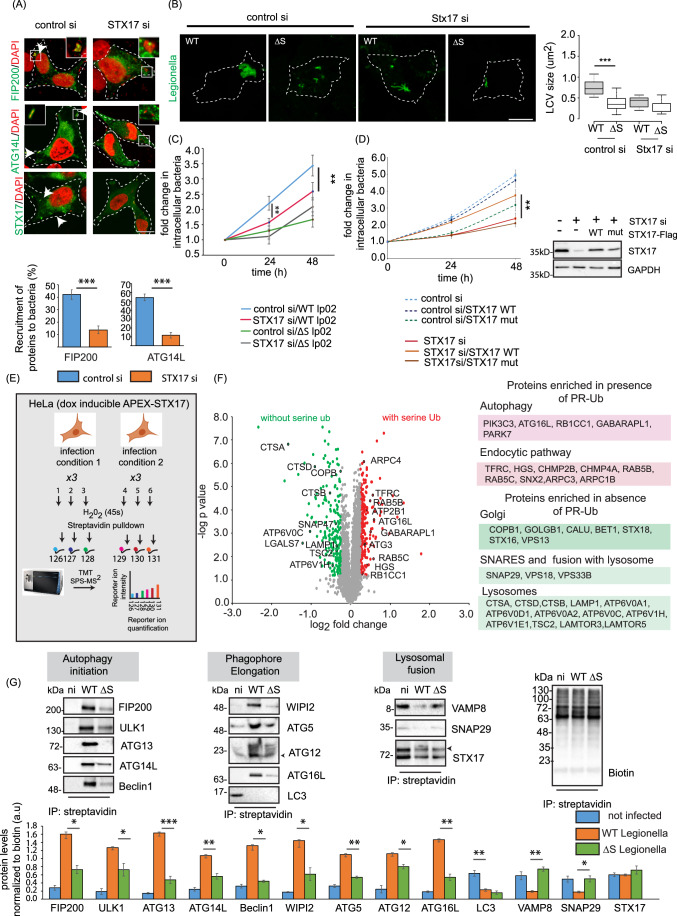
Legionella pneumophila is an intracellular pathogen that causes Legionnaires' disease. The bacteria release effector proteins, some of which remodel host autophagic-lysosomal pathways. One such effector is RavZ, which delipidates ATG8 proteins, making compromising autophagy in Legionella-infected cells. Here we show that SidE effectors also affect these pathways, by mediating phosphoribosyl-ubiquitination (PR-Ub) of the autophagic SNARE proteins STX17 and SNAP29. STX17 modification induces recruitment of STX17-positive membranes from the endoplasmic reticulum to Legionella-containing phagosomes, forming replicative vacuoles. Using proximity labeling, biochemistry and Legionella infection studies, we define a mechanism by which autophagy is hijacked by bacteria to recruit ER membranes to the bacterial vacuole, via a structure bearing autophagy markers but not fusing with lysosomes. Mass-spectrometric identification of PR-Ub sites and mutational studies show that phosphoribosyl-ubiquitination of STX17 alters its interaction with ATG14L, which causes ER membranes to be recruited to the bacterial vacuole in a PI3K-dependent manner. On the other hand, phosphoribosyl-ubiquitination of SNAP29 inhibits the formation of the autophagosomal SNARE complex (STX17-SNAP29-VAMP8) via steric hindrance, thus preventing the fusion of bacterial vacuoles with lysosomes.

Keywords: Legionella pneumophila; Autophagy; Syntaxin17; Ubiquitin; Xenophagy.


Conflict of interest statement

Disclosure and competing interests statement. The authors declare no competing interests.

Figures

Figure 1
Figure 1. The Legionella effectors SidE and RavZ regulate autophagy during infection.
(A) Legionella effectors that regulate autophagy. (B) A549 cells were infected with Legionella strains for 6 h, then endogenous LC3 was immunostained for confocal imaging. Uninfected cells were treated with 100 nM Torin-1 for 4 h to induce autophagosome formation. In the box plot, center lines show the medians; box limits indicate the 25th and 75th percentiles as determined by R software; whiskers extend 1.5 times the interquartile range from the 25th and 75th percentiles, outliers are represented by dots. n = 34, 31 cells taken from three independent experiments. P value was calculated using two-tailed, type 3 Student’s t test, For the graph showing LC3 vesicles/cells: ***P = 1.139E-11 (WT vs ΔR), **P = 0.00853 (ΔR vs ΔRΔS). For the graph showing % of bacteria in LC3B-positive vesicles: ***P = 1.5E-6 (WT vs ΔR), **P = 1.74E-4 (ΔR vs ΔRΔS). Scale bar: 5 µm. (C) A549 cells were transfected with RFP-GFP-LC3 before infection with Legionella strains in the presence of 100 nM Torin-1 for 4 h. The cells were then fixed for immunostaining with a Legionella-specific antibody and confocal imaging. We counted the total number of puncta and the number of red puncta per cell in FIJI. In the box plots, center lines show the medians; box limits indicate the 25th and 75th percentiles as determined by R software; whiskers extend 1.5 times the interquartile range from the 25th and 75th percentiles. n > 50 cells taken from three independent experiments. P value was calculated using two-tailed, type 3 Student’s t test, For the graph showing % acidic vesicles: ***P = 6.27E-12 (WT vs ΔS), ***P = 5.66E-31 (ΔR vs ΔRΔS). For the graph showing % of bacteria in acidic LC3B vesicles: ***P = 1.98E-11 (ΔR vs ΔRΔS). Scale bar: 5 µm. Dotted lines indicate cell outlines drawn from thresholding images in FIJI. (D) A549 cells were infected with Legionella strains for 4 h in the presence of 200 nM Torin-1 and/or 100 μM chloroquine as indicated. The cells were lysed and analyzed by western blot with antibodies against LC3 and GAPDH. The data are means ± SEM of chemiluminescent intensity detected from three western blots taken from three independent experiments. P value was calculated using a two-tailed, type 3 Student’s t test. *P = 0.0216. (E) A549 cells were infected with different strains of Legionella for 4 h before fixation and immunostaining with a LAMP1-specific antibody. We counted the number of LAMP1+ bacteria per cell. The data are means ± SEM of 30 cells from three independent experiments. P value was calculated using a two-tailed, type 3 Student’s t test. ***P = 1.96E-6. Scale bar: 5 µm. Dotted lines indicate cell outlines drawn from thresholding images in FIJI. ni not infected, WT wild-type, Legionella, ΔS-ΔSidE, ΔD-ΔDup, ΔR-ΔRavZ, ΔRΔS-ΔRavZΔSidE Legionella). Source data are available online for this figure.
Figure 2
Figure 2. STX17 and SNAP29 are PR-Ub modified during Legionella infection.
(A) HEK 293T cells expressing FLAG-STX17 were infected with different strains of Legionella for 2 h. Lysates were used for GST pulldown with the DupA trapping mutant GST-DupA (H67A), followed by western blots with antibodies against FLAG, GST, and ubiquitin. Whole-cell lysates were blotted with antibodies against FLAG and vinculin as a loading control. This experiment was repeated three times with similar results. (B) HEK 293T cells expressing V5-SNAP29 were infected with different Legionella strains for 2 h. Lysates were used for GST pulldown with the DupA trapping mutant GST-DupA (H67A) followed by western blotting with antibodies against V5, GST, and ubiquitin. Whole-cell lysates were probed with antibodies against V5 and vinculin as a loading control. This experiment was repeated three times with similar results. (C) Domain architecture of STX17 and SNAP29 showing the PR-ubiquitination sites. (D) A549 cells expressing GFP-tagged STX17, STX17TM or the PR-Ub deficient mutant of STX17 were infected with Legionella strains for 2 h before fixation and immunostaining with a Legionella-specific antibody for analysis by confocal microscopy. Control cells were treated with 300 nM Torin-1 for 4 h. Dotted lines indicate cell outlines drawn from thresholding images in FIJI. Scale bar: 5 µm. Scale bar in inset: 2 µm. (E) The number of STX17+ bacteria per cell were counted for ~50 cells taken three different experiments. In the box plots, center lines show the medians; box limits indicate the 25th and 75th percentiles as determined by R software; whiskers extend 1.5 times the interquartile range from the 25th and 75th percentiles, outliers are represented by dots. N = 52, 56 cells taken from three experimental replicates. P value was calculated using two-tailed, type 3 Student’s t test, ***P = 7.43E-8. Scale bar: 5 µm. (F) The formation of WT and PR-Ub-deficient SNAP29-GFP puncta was monitored in Legionella-infected cells 4 h post-infection. Dotted lines indicate cell outlines drawn from thresholding images in FIJI. (G) SNAP29 puncta were counted in 50-μm2 regions of interest using FIJI. In the box plot, center lines show the medians; box limits indicate the 25th and 75th percentiles as determined by R software; whiskers extend 1.5 times the interquartile range from the 25th and 75th percentiles. n > 50 cells taken from three independent experiments. P value was calculated using two-tailed, type 3 Student’s t test, For the graph SNAP29 puncta/cell: ***P = 6.82E-20. For the graph % cells with SNAP29 recruitment to bacteria: ***P = 2.27E-5 (WT, SNAP29WT vs ΔS, SNAP29WT) ***P = 2.56E-6 (WT, SNAP29WT vs WT, SNAP29mut. Scale bar: 5 µm. Source data are available online for this figure.
Figure 3
Figure 3. Autophagy proteins are recruited to bacteria 1 h post-infection.
(A) A549 cells were infected with WT or ΔS Legionella for 1 h, fixed and immunostained with the indicated antibodies to check for the recruitment of endocytic and autophagic markers to intracellular bacteria. Scale bar: 5 µm. White arrows mark intracellular bacteria. Dotted lines indicate cell outlines drawn from thresholding images in FIJI. (B) The experiment in (A) was quantified to measure the recruitment of each protein to intracellular bacteria. The total number of intracellular bacteria per cell and the number of bacteria which is surrounded by the protein marker were counted manually in FIJI to find the % of intracellular bacteria which were positive for the recruitment of the protein. The data are means ± SEM of 50 cells representing three experiments. P value was calculated using a two-tailed type 3 Student's t test. ***P = 3.15E-5 (STX17), **P = 0.0066 (ULK2), **P = 0.01 (ATG14L), **P = 0.001(FIP200), n.s. P = 0.42(Rab5). Dotted lines indicate cell outlines drawn from thresholding images in FIJI. (C) Proximity labeling of bacterial vacuoles in digitonin-permeabilized cells 2 h post-infection. (D) Western blots of the indicated proteins after streptavidin pulldown from lysates derived from cells treated with TurboID-ProtA and Legionella antibody. The data represent means ± SD taken from three independent experiments. P value was calculated using a two-tailed type 3 Students t test. n.s. P = 0.44 (Rab5), n.s. P = 0.802 (EEA1), *P = 0.013 (STX17), **P = 0.006 (FIP200), *P = 0.03(ATG14L), n.s. P = 0.387 (ATG5), n.s. P = 0.523 (ATG12), n.s. P = 0.714 (CANX). (E) HeLa cells expressing CD32 (for efficient uptake of Legionella) were uninfected (n.i.) infected with WT or ΔS Legionella for 6 h, fixed and prepared by following a protocol which was similar to that in (C), and imaged by TEM. In total, 30 images collected from three experiments were analyzed to count number of large electron-dense bacterial vacuoles and the number of early phagosome-like vacuoles. Error bars represent ± SD. P value was calculated using two-tailed type 3 Student’s t test, ***P = 1.008E-8. Arrows mark intracellular bacteria in lysosome-like vesicles (in WT) or in smaller phagosomes (in ΔS) (WT wild-type, Legionella, ΔS-ΔSidE Legionella). Source data are available online for this figure.
Figure 4
Figure 4. STX17 is crucial for the formation of a replicative vacuole and interacts with proteins of the endosomal and autophagy pathways during Legionella infection.
(A) A549 cells were treated with control or STX17 siRNA for 48 h followed by infection with WT Legionella. Cells were fixed and stained for the indicated autophagy markers 1 h after infection. The data are means ± SEM of 50 cells representing three experiments. which were analyzed per sample to quantify recruitment of FIP200 and ATG14L to bacteria. P value was calculated using two-tailed type 3 Student’s t test, ***P = 5.83E-7 (FIP200), ***P = 1.92E-12 (ATG14L), Scale bar: 5 µm. Dotted lines indicate cell outlines drawn from thresholding images in FIJI. (B) A549 cells were treated with STX17 or control siRNA for 48 h followed by infection with WT or ΔS Legionella for 12 h (MOI = 1). Cells were fixed for immunostaining with a Legionella-specific antibody followed by confocal microscopy. The LCV size was estimated in FIJI. In the box plot, center lines show the medians; box limits indicate the 25th and 75th percentiles as determined by R software; whiskers extend 1.5 times the interquartile range from the 25th and 75th percentiles, outliers are represented by dots. n = 32, 31 cells taken from three independent experiments. p value was calculated using two-tailed, type 3 Student’s t test, ***P = 8.13E-16. Scale bar: 5 µm. Dotted lines indicate cell outlines drawn from thresholding images in FIJI. (C) A549 cells were treated with control or STX17 siRNA for 48 h followed by infection with WT or ΔS Legionella. Intracellular bacterial replication was assessed after 0, 24, and 48 h. Data are means ± SEM of three independent experiments. P value was calculated using two-tailed type 3 Student’s t test, **P = 0.00526 (WT, control vs STX17siRNA, 24 h), **P = 0.00815 (WT, control vs STX17siRNA, 48 h). (D) A549 cells were treated with STX17 or control siRNA for 48 h followed by transfection with WT or PR-Ub-deficient STX17 for 24 h. Intracellular bacterial replication was assessed after 0, 24, and 48 h. Data are means ± SEM of three independent experiments **P = 0.0077 (WT, STX17siRNA versus STX17 mutant, STX17siRNA, 48 h). Western blotting with STX17 antibody shows knockdown efficiency of STX17 siRNA and reconstitution with WT or mutant STX17. (E) Proximity labeling assay workflow. HeLa cells expressing doxycycline-inducible APEX-STX17 and CD32(for increasing the efficiency of Legionella uptake) were infected with Legionella for 2 h before treatment with biotin-tyramide and H2O2 followed by streptavidin pulldown. The samples were reduced, alkylated and digested with trypsin before MS analysis. Samples representing three biological replicates each of non-infected and Legionella-infected cells were analyzed in a single reaction by 6-plex TMT labeling. (F) Volcano plot showing changes in the biotin-labeled proteome following the infection of HeLa cells expressing APEX2-FLAG-STX17 with ΔR and ΔRΔS Legionella for 2 h, GO analysis of the biotin-labeled proteome showing pathways upregulated by infection with ΔR vs ΔRΔS Legionella. Data represents mean fold change of three experimental replicates per infection set (n = 3). P value was calculated using two-tailed type 3 Student’s t test and significant candidates were chosen having P value ≤ 0.01 and log2 (fold change) value minimum of ±0.5. Red and green indicate compartments containing proteins enriched following infection with ΔR and ΔRΔS Legionella, respectively. (G) Cells expressing doxycycline-inducible APEX-STX17 were infected with Legionella for 2 h before treatment with biotin-tyramide and H2O2 followed by streptavidin pulldown. The samples were analyzed by western blot with antibodies against proteins of the autophagic and endosomal pathways. The data represent means ± SD of three independent experiments. P value was calculated using two-tailed type 3 Students t test. WT vs ΔS P values: *P = 0.01006 (FIP200), **P = 0.0206 (ULK1), P = ***0.0007 (ATG13) **P = 0.005 (ATG14), *P = 0.0111(Beclin1), *P = 0.0219 (WIPI2), **P = 0.0038 (ATG5), *P = 0.018 (ATG12), **P = 0.001 (ATG16), **P = 0.0036 (VAMP8), *P = 0.0424 (SNAP29). (n.i. not infected, WT wild-type, Legionella, ΔS ΔSidE Legionella). Source data are available online for this figure.
Figure 5
Figure 5. PR-Ub of STX17 increases its interaction with ATG14L; while PR-Ub of SNAP29 blocks the mutual interaction between SNARE domains of STX17 and SNAP29.
(A) PR-Ub (PDB ID: 5M93) was manually attached to residue S63 of SNAP29 in the structure of the STX17-SNAP29-VAMP8 complex (7BV6) using Pymol. (B) Schematic showing the formation of the autophagosomal SNARE complex, and the effect of PR-ub on its formation. (C) Untagged SNAP29 and STX17-GST was purified from E. coli and incubated with His-tagged Ub in an in vitro PR-ub assay. PR-Ub modified STX17 and SNAP29 were enriched by nickel-NTA-based affinity purification and incubated with 100 µg protein lysate from HEK 293T cells. This was followed by GST-pulldown of STX17 and antibody-based immunoprecipitation of SNAP29 to check for alterations in protein-protein interactions upon PR-Ub. The data represents means ± SD of three independent experiments P value was calculated using two-tailed type 3 Students t test 0.001 < **P ≤ 0.01). **P = 0.004 (VAMP8), **P = 0.001 (ATG14L), **P = 0.022 (PR-Ub STX17). (D) WT and PR-Ub-modified SNAP29 were incubated with equimolar amounts of purified GST-STX17, VAMP8 and ATG14L. Interactors of PR-Ub-modified SNAP29 were observed by immunoblotting. The data represent means ± SD of three independent experiments. P value was calculated using two-tailed type 3 Students t test. **P = 0.0068 (STX17), **P = 0.0059 (VAMP8). (E) WT or PR-Ub modified GST-STX17 were incubated with equimolar amounts of purified GST-STX17, VAMP8 and ATG14L. Interactors of PR-Ub modified STX17 were observed by immunoblotting. The data represent means ± SD of three independent experiments. P value was calculated using two-tailed type 3 Students t test. **P = 0.042 (ATG14L), **P = 0.029 (SNAP29). (F) WT or PR-Ub modified forms of both STX17 and SNAP29 were incubated with VAMP8 and ATG14L followed by immunoprecipitation of GST-STX17 and immunoblotting to check for protein-protein interactions. Pure proteins were run as the reaction inputs and immunoblotted with indicated antibodies. The data represent means ± SD of three independent experiments. P value was calculated using two-tailed type 3 Students t test. **P = 0.0208 (ATG14L), **P = 0.023 (VAMP8), ***P = 0.00046 (SNAP29). (G) Schematic showing the effect of PR-Ub of STX17 and SNAP29 on bacterial vacuole formation. PR-Ub of STX17 enhances interactions with ATG14L which results in the recruitment of ER membranes to the bacterial vacuole.PR-Ub of SNAP29 prevents fusion of the STX17-positive vacuoles with the VAMP8-positive lysosomes. Source data are available online for this figure.
Figure EV1
Figure EV1. PR-Ub regulates autophagy in Legionella infection.
(A) SNARE proteins that were identified as PR-Ub substrates (Shin et al, 2020). (B) A549 cells were infected with different strains of Legionella for 2 h in the presence of 300 nM bafilomycin A1, then lysed and analyzed by western blot with antibodies against LC3 (and GAPDH as a loading control). The experiment was repeated three times with similar results. (C) HEK 293T cells were transfected with SdeA, its catalytic mutant SdeA (EE/AA) or a control vector for 16 h. Cells were treated with 100 nM Torin-1 as shown, then lysed and analyzed by western blot to check for LC3 levels. GAPDH was used as a loading control. Graph represents data from three independent experiments. Error bars indicate standard deviation. P value was calculated using two-tailed, type 3 Student’s t test, **0.01 ≤ P < 0.001. (D) HeLa cells were cotransfected with RFP-GFP-LC3 and HA-tagged SdeA/SdeA(EE/AA) or a control vector for 16 h before treatment with 300 nM Torin-1 for 4 h to induce autophagy. The cells were then fixed and incubated with an anti-HA antibody for confocal imaging. We counted the total number of puncta and the number of red puncta per cell in FIJI. The data are means ± SEM of 30 cells from three independent experiments (**P = 0.002 (vector vs SdeA), **P = 0.041(SdeA vs SdeA(EE/AA)). Scale bar: 5 μm. Dotted lines indicate cell outlines drawn from thresholding images in FIJI. (E) A549 cells were infected with the indicated strains of Legionella, and their intracellular replication was assessed at 0, 24 and 48 h post-infection. The data are means ± SEM of three independent experiments *P = 0.012 (WT vs ΔS), **P = 0.00203 (WT vs ΔRΔS). (F) RAW264.7 cells were infected with the indicated strains of Legionella, and their intracellular replication was assessed at 0, 24 and 48 h post-infection. The data are means ± SEM of three independent experiments. **P = 0.0062 (WT vs ΔS), **P = 0.00072 (WT vs ΔRΔS).
Figure EV2
Figure EV2. STX17 and SNAP29 are modified by PR-Ub on specific serine residues during Legionella infection.
(A) (i) HEK 293 T cells were cotransfected with FLAG-STX17 and GFP-tagged SdeA/SdeA(EE/AA) or a control vector for 16 h. FLAG-STX17 was immunoprecipitated using FLAG resin and analyzed by western blot using antibodies against FLAG to detect PR-Ub-modified and unmodified FLAG-STX17. The experiment was repeated 2 times with similar results. (ii) HEK 293T cells were cotransfected with FLAG-STX17 and GFP-tagged SdeA/SdeA(EE/AA) or a control vector and immunoprecipitated as shown in (B). The samples were then treated with or without pure DupA for 1 h before western blotting with antibodies against FLAG to detect PR-Ub-modified and unmodified FLAG-STX17. The experiment was repeated two times with similar results. (B) HEK 293T cells were cotransfected with GFP-SNAP29 and HA-tagged SdeA/SdeA(EE/AA) or a control vector for 16 h. GFP-SNAP29 was immunoprecipitated with anti-GFP beads, treated with or without pure DupA for 1 h and analyzed by western blot with antibodies against GFP to detect PR-Ub-modified and unmodified SNAP29. The experiment was repeated two times with similar results. (C) GST-STX17 and GST-STX17(S195AS202AS209A) were incubated with or without SdeA in the presence of 1 mM NAD+ and ubiquitin for 1 h. The samples were analyzed by western blot using antibodies against ubiquitin and GST to detect PR-Ub. The experiment was repeated three times with similar results. (D) GST-STX17 and its PR-Ub-deficient mutant (S195AS202AS209A) were modified with or without SdeA, in the presence of 1 mM NAD+ and ubiquitin for 1 h. Samples were analyzed by western blot with antibodies against ubiquitin and GST to detect PR-Ub. The experiment was repeated three times with similar results. SdeA(EE/AA): mART mutant SdeA(E860AS862A) (E) GST-SNAP29 and its PR-Ub-deficient mutant (S61AS63AS70A) were modified with or without SdeA, in the presence of 1 mM NAD+ and ubiquitin for 1 h. Samples were analyzed by western blot with antibodies against ubiquitin and GST to detect PR-Ub. The experiment was repeated three times with similar results. SdeA(EE/AA): mART mutant SdeA(E860AS862A).
Figure EV3
Figure EV3. Identification of STX17 residues modified by PR-Ub.
Mass spectra of PR-Ub-modified STX17(1–224). S202, S209 were identified as the modified serine residues by high-resolution ETD mass spectrometry.
Figure EV4
Figure EV4. Identification and validation of serine residues on STX17 and SNAP29 that are modified by PR-Ub.
(A) Mass spectrum and deduced sequence map of PR-Ub-modified SNAP29. (B) HEK 293 T cells were transfected with GFP-tagged WT STX17, STX17TM, or the STX17 serine mutant (S195AS202AS209A) followed by Legionella infection for 2 h. STX17 was then immunoprecipitated using anti-GFP beads followed by western blotting with antibodies against GFP and ubiquitin. Cell lysates were analyzed by western blot with an antibody against GFP to check the expression levels of GFP-STX17 constructs. The experiment was repeated three times with similar results.
Figure EV5
Figure EV5. Recruitment of STX17 and SNAP29 to bacterial vacuoles is regulated by their PR-Ub.
(A) A549 cells expressing STX17-GFP were infected with WT Legionella for 2 h in the presence or absence of 100 nM brefeldin A before fixation and staining the intracellular bacteria by DAPI. STX17-positive bacteria was counted in 50 cells per set, taken from three independent experiments. Error bars indicate SEM. Difference between sets was non-significant from p value calculated by two-tailed, type 3 Student’s t test. Scale bar:10 µm. (B) A549 cells expressing STX17-GFP were infected with Legionella (WT/ΔS) for 2 h in the presence or absence of 100 nM wortmannin before fixation and immunostaining with antibodies against Legionella. p value was calculated by two-tailed, type 3 Student’s t test. ***P = 4.45E-6(WT and ΔS sets without wortmannin), ***P = 2.05E-5 (WT +/-wortmannin), Graph represents n = 50 cells taken from three experiments, error bars indicate SEM. Scale bar: 5 µm. Dotted lines indicate cell outlines drawn from thresholding images in FIJI. (C) Immuno-electron microscopy of HeLa cells transfected with STX17-GFP and infected with WT Legionella-DsRed for 4 h. Ultrathin cryosection immunogold labeled for STX17-GFP by protein A–10-nm gold. Colors are added by Photoshop: Yellow marks a STX-17.GFP-positive ER cisterna closely aligned with the Legionella (Leg) containing vacuole. Green marks the space between the vacuolar membrane and enclosed Legionella. Bar, 200 nm. (D) A549 cells were infected with WT or ΔRΔS Legionella for 1 h, fixed and immunostained with the STX17 and Legionella antibodies to check for the recruitment of STX17 to intracellular bacteria. White arrows mark intracellular bacteria with STX17 recruitment. The data are means ± SEM of 118 cells from three independent experiments. p value was calculated by two-tailed, type 3 Student’s t test. ***P = 4.21E-6. Scale bar: 5 µm. Dotted lines indicate cell outlines drawn from thresholding images in FIJI. (E) A549 cells were infected with WT or ΔRΔS Legionella for 1 h, fixed and immunostained with the SNAP29 and Legionella antibodies to check for the recruitment of SNAP29 to intracellular bacteria. White arrows mark intracellular bacteria with SNAP29 recruitment. The data are means ± SEM of 120 cells from three independent experiments. p value was calculated by two-tailed, type 3 Student’s t test. ***P = 2.21E-4. Scale bar: 5 µm. Dotted lines indicate cell outlines drawn from thresholding images in FIJI. (F) HeLa cells were cotransfected with RFP-tagged SdeA or its catalytic mutant (E860AE862A) and GFP-tagged WT SNAP29 or its PR-Ub-deficient mutant. Cells were treated with 300 nM Torin-1 for 4 h to induce autophagy before fixation and confocal imaging. Scale bar:5 µm. Dotted lines indicate cell outlines drawn from thresholding images in FIJI. (G) The graph shows the number of cells with SNAP29-GFP puncta (from panel d) counted in FIJI. In the box plot, center lines show the medians; box limits indicate the 25th and 75th percentiles as determined by R software; whiskers extend 1.5 times the interquartile range from the 25th and 75th percentiles. n > 30 cells taken from three independent experiments. P value was calculated using two-tailed, type 3 Student’s t test, ***P = 0.00032. In bar graph, the data are means ± SEM of n > 30 cells from three independent experiments. Scale bar:5 µm. (H) A549 cells were treated with SNAP29 or control siRNA for 48 h followed by infection Legionella. Intracellular bacterial replication was assessed after 0, 24 and 48 h. Data are means ± SEM of three independent experiments. P value was calculated using two-tailed, type 3 Student’s t test, ***P = 2.1E-4 (ΔR), **P = 0,.031(ΔRΔS). (ni not infected, WT wild-type, Legionella, ΔS-ΔSidE Legionella).
Figure EV6
Figure EV6. Proximity labeling of STX17 during Legionella infection.
(A) HeLa cells expressing CD32 (for efficient uptake of Legionella) were infected with WT Legionella for 2 h or 6 h. Cells were fixed using 2.5% glutaraldehyde in 0.1 M cacodylate buffer for two hours at RT. Cells were scraped of the petridish, post-fixed with 1% reduced osmium tetroxide at RT, dehydrated and embedded using EPON. Ultrathin sections (50 nm) were imaged by transmission electron microscopy. Arrows mark intracellular bacteria, Lyl-lysosome-like organelles. (B) HeLa cells expressing APEX2-FLAG-STX17 are infected with WT Legionella for 2 h followed by fixing cells and staining cells with FLAG antibody to check its recruitment to intracellular bacteria. DAPI marks nuclear DNA and cytosolic bacteria. Scale bar:5 µm. White arrows indicate intracellular bacteria. (C) Lysates used as input in streptavidin IP shown in Fig. 4G. (D) Volcano plot showing how the biotin-labeled proteome changes when HeLa cells expressing APEX-STX17 are infected with WT Legionella for 2 h; GO analysis of the biotin-labeled proteome showing pathways upregulated by infection with WT Legionella. Red and green indicate compartments containing proteins enriched following infection with WT Legionella and in uninfected cells, respectively. Data represent mean fold change of three experimental replicates per infection set (n = 3). P value was calculated using two-tailed type 3 Student’s t test and significant candidates were chosen having P value ≤ 0.01 and log2(fold change) value minimum of ±0.5. (E) Volcano plot showing changes in the biotin-labeled proteome following the infection of HeLa cells expressing APEX-STX17 with WT and ΔS Legionella for 2 h. GO analysis of the biotin-labeled proteome showing pathways upregulated by infection with WT vs ΔS Legionella. Data represents mean fold change of three experimental replicates per infection set (n = 3). P value was calculated using two-tailed type 3 Student’s t test and significant candidates were chosen having P value ≤ 0.01 and log2 (fold change) value minimum of ±0.5. Red and green indicate compartments containing proteins enriched following infection with WT and ΔS Legionella, respectively. (ni not infected, WT wild-type Legionella, ΔS-ΔSidE).

References

    1. Akturk A, Wasilko DJ, Wu X, Liu Y, Zhang Y, Qiu J, Luo Z, Reiter KH, Brzovic PS, Klevit RE et al (2018) Mechanism of phosphoribosyl-ubiquitination mediated by a single Legionella effector. Nature 557(7707):729–733 - PMC - PubMed
    1. Aman Y, Schmauck-Medina T, Hansen M, Morimoto RI, Simon AK, Bjedov I, Fang EF, Bjedov I, Palikaras K, Simonsen A, Johansen T, Tavernarakis N et al (2021) Autophagy in healthy aging and disease. Nat Aging 1(8):634–650 - PMC - PubMed
    1. Arasaki K, Tagaya M (2017) Legionella blocks autophagy by cleaving STX17 (syntaxin 17). Autophagy 13(11):2008–2009 - PMC - PubMed
    1. Bhogaraju S, Bonn F, Mukherjee R, Adams M, Pfleiderer MM, Galej WP, Dikic I (2019) Inhibition of bacterial ubiquitin ligases by SidJ–calmodulin catalysed glutamylation. Nature 572(7769):382–386 - PMC - PubMed
    1. Bhogaraju S, Kalayil S, Liu Y, Bonn F, Colby T, Matic I, Dikic I (2016) Phosphoribosylation of ubiquitin promotes serine ubiquitination and impairs conventional ubiquitination. Cell 167(6):1636–1649 - PubMed

MeSH terms