Integrating Metabolomics and Gut Microbiota to Identify Key Biomarkers and Regulatory Pathways Underlying Metabolic Heterogeneity in Childhood Obesity
- PMID: 40507148
- PMCID: PMC12158115
- DOI: 10.3390/nu17111876
Integrating Metabolomics and Gut Microbiota to Identify Key Biomarkers and Regulatory Pathways Underlying Metabolic Heterogeneity in Childhood Obesity
Abstract
Background/objectives: Individuals with childhood obesity exhibit significant metabolic heterogeneity, necessitating precise biomarkers for risk stratification and assessment. This multi-omics investigation characterizes metabolic and microbial signatures underlying divergent metabolic phenotypes in the context of pediatric obesity.
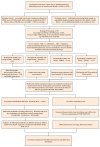
Methods: We analyzed 285 Chinese children (5-7 years) stratified into five groups: wasting (WAS, n = 55), metabolically healthy/unhealthy and normal weight (MHWH, n = 54; MUWH, n = 67), and metabolically healthy/unhealthy obesity (MHO, n = 36; MUO, n = 73). Untargeted metabolomics (Orbitrap ID-X Tribrid™) and 16S rRNA sequencing were integrated with multivariate analyses (OPLS-DA with VIP > 1, FDR < 0.05; Maaslin 2 with TSS normalization and BH correction, FDR < 0.10).
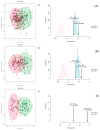
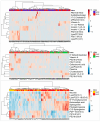
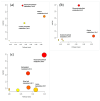
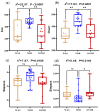
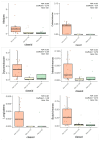
Results: Analysis identified 225 differential metabolites and 12 bacterial genera. The proportion of steroids and their derivatives among differential metabolites in the MUO/MHO group was significantly lower than that in the OVOB/NOR and OVOB/WAS groups (2.12% vs. 7.9-14.1%). MUO displayed elevated C17 sphinganine and LysoPC (O-18:0) levels but reduced PI (16:0/14:1) levels. In contrast, OVOB showed upregulated glycerol phospholipids (LPCs and PSs) and downregulated PE species (e.g., PE(16:0/16:0)) as well as gut microbiota dysbiosis characterized by a higher Firmicutes/Bacteroidetes (F/B) ratio (2.07 vs. 1.24 in controls, p = 0.009) and reduced α diversity (Ace index, Chao1 index, and Shannon index values were lower in the OVOB group, Shannon index: 2.96 vs. 3.45, p = 0.03). SCFA-producing genera were negatively correlated with the OVOB group, while positively associated with PE(16:0/16:0). Internal validation showed differential metabolites had potential predictive efficacy for MUO/MHO (AUC = 0.967) and OVOB/NOR (AUC = 0.888).
Conclusions: We identified distinct lipid disruptions characterizing obesity subtypes, including steroid/terpene deficits and sphingolipid/ether lipid dysregulation in the MUO/MHO groups as well as phospholipid imbalance (↑LPC/PS↓PE) in the OVOB/NOR groups. The gut microbiota exhibited a profile characterized by low diversity, an increased F/B ratio, and a reduced abundance of SCFA-producing genera. These findings suggest potential biomarkers for childhood obesity stratification, though further validation is warranted.
Keywords: childhood obesity; gut microbiota; metabolic heterogeneity; metabolomics; multi-omics.
Conflict of interest statement
The authors declare no conflicts of interest.
Figures





Similar articles
-
Gut microbiota and fecal volatilome profile inspection in metabolically healthy and unhealthy obesity phenotypes.J Endocrinol Invest. 2024 Dec;47(12):3077-3090. doi: 10.1007/s40618-024-02379-2. Epub 2024 Jun 21. J Endocrinol Invest. 2024. PMID: 38904913 Free PMC article.
-
The role of the gut microbiota on the metabolic status of obese children.Microb Cell Fact. 2021 Feb 27;20(1):53. doi: 10.1186/s12934-021-01548-9. Microb Cell Fact. 2021. PMID: 33639944 Free PMC article.
-
Gut microbiota is associated with metabolic health in children with obesity.Clin Nutr. 2022 Aug;41(8):1680-1688. doi: 10.1016/j.clnu.2022.06.007. Epub 2022 Jun 15. Clin Nutr. 2022. PMID: 35777107
-
Association between childhood obesity and gut microbiota: 16S rRNA gene sequencing-based cohort study.World J Gastroenterol. 2024 Apr 28;30(16):2249-2257. doi: 10.3748/wjg.v30.i16.2249. World J Gastroenterol. 2024. PMID: 38690025 Free PMC article.
-
Biomarkers of intestinal permeability are associated with inflammation in metabolically healthy obesity but not normal-weight obesity.Am J Physiol Heart Circ Physiol. 2024 Nov 1;327(5):H1135-H1145. doi: 10.1152/ajpheart.00381.2024. Epub 2024 Aug 30. Am J Physiol Heart Circ Physiol. 2024. PMID: 39212768
References
-
- Dong Y., Lau P.W.C., Dong B., Zou Z., Yang Y., Wen B., Ma Y., Hu P., Song Y., Ma J., et al. Trends in physical fitness, growth, and nutritional status of Chinese children and adolescents: A retrospective analysis of 1·5 million students from six successive national surveys between 1985 and 2014. Lancet Child Adolesc. Health. 2019;3:871–880. doi: 10.1016/S2352-4642(19)30302-5. - DOI - PubMed
MeSH terms
Substances
Grants and funding
LinkOut - more resources
Full Text Sources
Medical
Research Materials
Miscellaneous

