Review
. 2025 May 31;17(11):1903.
doi: 10.3390/nu17111903.

Methodological Review of Classification Trees for Risk Stratification: An Application Example in the Obesity Paradox

Affiliations
Review

Methodological Review of Classification Trees for Risk Stratification: An Application Example in the Obesity Paradox

Javier Trujillano et al. Nutrients. .

Abstract

Background: Classification trees (CTs) are widely used machine learning algorithms with growing applications in clinical research, especially for risk stratification. Their ability to generate interpretable decision rules makes them attractive to healthcare professionals. This review provides an accessible yet rigorous overview of CT methodology for clinicians, highlighting their utility through a case study addressing the "obesity paradox" in critically ill patients.

Methods: We describe key methodological aspects of CTs, including model development, pruning, validation, and classification types (simple, ensemble, and hybrid). Using data from the ENPIC (Evaluation of Practical Nutrition Practices in the Critical Care Patient) study, which assessed artificial nutrition in ICU (intensive care unit) patients, we applied various CT approaches-CART (classification and regression trees), CHAID (chi-square automatic interaction detection), and XGBoost (extreme gradient boosting)-and compared them with logistic regression. SHAP (SHapley Additive exPlanation) values were used to interpret ensemble models.

Results: CTs allowed for identification of optimal cut-off points in continuous variables and revealed complex, non-linear interactions among predictors. Although the obesity paradox was not confirmed in the full cohort, CTs uncovered a specific subgroup in which obesity was associated with reduced mortality. The ensemble model (XGBoost) achieved the best predictive performance (highest area under the ROC curve), though at the expense of interpretability.

Conclusions: CTs are valuable tools in clinical epidemiology, complementing traditional models by uncovering hidden patterns and enhancing risk stratification. While ensemble models offer superior predictive accuracy, their complexity necessitates interpretability techniques such as SHAP. CT-based approaches can guide personalized medicine but require cautious interpretation and external validation.

Keywords: classification trees; intensive care unit; machine learning; obesity paradox; prediction modelling.


Conflict of interest statement

The authors declare no conflicts of interest.

Figures

Figure 1
Figure 1
Using CHAID-type AC trees to establish cut-off points for continuous variables. (A) Cut-off points for age. (B) Cut-off points for the APACHE II severity score variable. R software (CHAID library) was used [23].
Figure 2
Figure 2
CART-type AC model to establish the relationship between two variables. Values in bold indicate 28-day mortality. SGA: subjective global assessment; BMI: body mass index group. It is observed that the non-malnutrition group of obese patients has a lower mortality rate. R software (rpart library) was used [23].
Figure 3
Figure 3
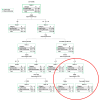
Multivariate model based on CART type. AGER: age groups; SGA: subjective global assessment; APA25: APACHE II score greater than 25; BMIG: body mass index group; PROTEIN: protein intake (g/kg/day). The hierarchy of variables is shown, and a special group in which obese patients have a lower mortality rate than those with overweight or a normal BMI is indicated in the red circle. AnswerTree 3.0 software was used [24].
Figure 4
Figure 4
Graph showing SHAP scores generated by the XGBoost model. AGER: age groups; KCAL: calorie intake (Kcal/kg/day); PROTEIN: protein intake (g/kg/day); SGA: subjective global assessment; APA25: APACHE II score greater than 25; BMIG: body mass index group. The importance of each variable can be observed, with age being the greatest. It is also observed that the obese patient group has a negative impact on mortality, suggesting a paradoxical effect of obesity. R software (xgboost and SHAPforxgboost libraries) was used [23].
Figure 5
Figure 5
Partial dependency graphs between each variable and mortality. AGER: age groups; KCAL: calorie intake (kcal/kg/day); PROTEIN: protein intake (g/kg/day); SGA: subjective global assessment; APA25: APACHE II score greater than 25; BMIG: body mass index groups. We observed different behavior between calorie and protein intake. Within the BMI groups, mortality was lower in the obese group. R software (SHAPforxgboost library) was used [23].
Figure 6
Figure 6
ROC analysis of the developed models. The area under the ROC curve values are shown. LR: logistic regression model; CART: CART-type classification tree; XGBoost: XGBoost-type ensemble classification tree model; Prob: probability of death at 28 days. The LR and CART-type AC models had similar AUCs. The XGBoost model achieved better discrimination (Long’s test with p < 0.001).

Similar articles

References

    1. Masic I. Medical Decision Making—An Overview. Acta Inform. Med. 2022;30:230–235. doi: 10.5455/aim.2022.30.230-235. - DOI - PMC - PubMed
    1. Podgorelec V., Kokol P., Stiglic B., Rozman I. Decision trees: An overview and their use in medicine. J. Med. Syst. 2002;26:445–463. doi: 10.1023/A:1016409317640. - DOI - PubMed
    1. Wei-Yin L. Fifty Years of Classification and Regression Trees. Int. Stat. Rev. 2014;82:329–348. doi: 10.1111/insr.12016. - DOI - PMC - PubMed
    1. Quinlan J.R. Induction of decision trees. Mach. Learn. 1986;1:81–106. doi: 10.1007/BF00116251. - DOI
    1. Trujillano J., Sarria-Santamera A., Esquerda A., Badia M., Palma M., March J. Approach to the methodology of classification and regression trees. Gac. Sanit. 2008;22:65–72. doi: 10.1157/13115113. - DOI - PubMed

LinkOut - more resources