. 2025 May 28;17(11):1799.
doi: 10.3390/cancers17111799.

Identification of an Immune-Related Gene Signature for Prognostic Prediction in Glioblastoma: Insights from Integrated Bulk and Single-Cell RNA Sequencing

Affiliations

Identification of an Immune-Related Gene Signature for Prognostic Prediction in Glioblastoma: Insights from Integrated Bulk and Single-Cell RNA Sequencing

Jianan Chen et al. Cancers (Basel). .

Abstract

Background: Glioblastoma is a highly malignant brain tumor with limited treatment options and a poor prognosis, largely driven by its complex immune microenvironment. This study aimed to identify and characterize an immune-related gene signature associated with prognosis and immune regulation in glioblastoma. Methods: We performed integrative analyses using bulk and single-cell RNA sequencing data to identify prognostically significant immune-related genes. A five-gene signature (THEMIS2, SIGLEC9, CSTA, LILRB3, and MS4A6A) was derived and its expression patterns were analyzed in association with immune cell infiltration and macrophage subtypes. Functional enrichment and pathway analyses were conducted, followed by drug sensitivity profiling to explore potential therapeutic implications. Results: The five-gene signature was significantly associated with worse survival outcomes and increased immune cell infiltration. Functional analyses revealed involvement in key immune pathways, including antigen presentation, cytokine signaling, and immune cell activation. Single-cell RNA sequencing demonstrated high expression of the signature in tumor-associated macrophages, particularly immune-suppressive and proliferation-associated subtypes. The high expression in proliferation TAMs suggests a role in promoting tumor angiogenesis and growth. Drug sensitivity analysis revealed distinct vulnerabilities between high- and low-risk groups based on signature expression. Conclusions: This Macrophage-Associated Prognostic Signature (MAPS) provides new insights into glioblastoma immunobiology and identifies potential biomarkers and therapeutic targets. It may serve as a valuable tool to guide personalized immunotherapy-based strategies for glioblastoma patients.

Keywords: angiogenesis; glioblastoma; immune signature; macrophages; prognosis; proliferation TAM; single-cell RNA-seq; tumor microenvironment.


Conflict of interest statement

The authors declare no conflicts of interest or relationships that could have influenced the findings or conclusions of this study.

Figures
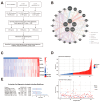
Figure 1
Figure 1
Identification and Validation of the Prognostic Gene Signature. (A) Workflow for identifying five immune-related prognostic genes (THEMIS2, SIGLEC9, CSTA, LILRB3, and MS4A6A) from three GBM datasets. (B) Gene interaction network showing functional connections among the five genes and key immune regulators. (C) Heatmap of gene expression in high- and low-risk groups based on risk score. (D) Risk score distribution and survival status. (E) Cox regression analysis confirming the prognostic significance of the gene signature.
Figure 2
Figure 2
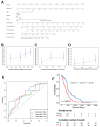
Nomogram and Validation of the Prognostic Model. (A) Nomogram integrating risk scores and clinical variables, including age, gender, and race, for predicting 1-year, 2-year, and 3-year overall survival. (BD) Calibration plots for 1-year (B), 2-year (C), and 3-year (D) survival probabilities. (E) Time-dependent ROC curves for 1-year, 2-year, and 3-year overall survival with corresponding AUC values. (F) Kaplan–Meier survival curves for overall survival in high-risk and low-risk groups.
Figure 3
Figure 3
Visualization and Functional Enrichment Analysis of DEGs. (A) Volcano plot displaying differentially expressed genes (DEGs) between high-risk and low-risk groups, with criteria set at |log2 fold change| > 1 and adjusted p-value < 0.01. (B) GO enrichment analysis of DEGs, categorized into biological process (BP), cellular component (CC), and molecular function (MF). (C) KEGG pathway enrichment analysis highlighting significant pathways involving DEGs. (D) GSEA plot showing enrichment of the cytokine–cytokine receptor interaction pathway.
Figure 4
Figure 4
Immune Checkpoint Correlation and Tumor Microenvironment Characteristics. (A) Correlation analysis of the gene signature with immune checkpoints. (B) Comparison of StromalScore, ImmuneScore, and ESTIMATEScore between high-risk and low-risk groups. (C) Expression levels of immune checkpoint molecules in high-risk and low-risk groups.
Figure 5
Figure 5
Mutation Landscape and Tumor Mutation Burden in High-Risk and Low-Risk Groups. (A) Mutation landscape of the high-risk group, showing the frequency and types of somatic mutations. (B) Distribution of tumor mutation burden in the high-risk group. (C) Mutation landscape of the low-risk group, displaying the frequency and types of somatic mutations. (D) Distribution of tumor mutation burden in the low-risk group.
Figure 6
Figure 6
Single-Cell RNA-Seq Analysis of the Gene Signature. (A) UMAP plot showing four major cell populations (macrophages, malignant cells, T cells, and oligodendrocytes) classified using the GSM3828673 dataset. (B) Expression patterns of THEMIS2, SIGLEC9, CSTA, LILRB3, and MS4A6A across cell populations. (C) UMAP visualization of macrophages stratified by gene signature scores, showing distinct high- and low-expression groups. (D) GO enrichment analysis of DEGs from macrophages with high and low gene signature expression. (E) KEGG pathway enrichment analysis of DEGs. (F) GSEA plot showing enrichment of DEGs in the systemic lupus erythematosus pathway.
Figure 7
Figure 7
Functional Analysis and Spatial Validation of the Gene Signature in Macrophages. (A) Pseudotime trajectory analysis using Slingshot, illustrating the transitional relationships among macrophage subtypes. (B) UMAP visualization of macrophage subpopulations classified into seven subtypes: Mg-TAM, Mo-TAM, Prol-TAM, Pre-TAM, Trans-TAM, Monocyte, and Dendritic Cell. (C) Module scores of the gene signature across macrophage subtypes (**** p < 0.0001). (DH) PCA analysis from the Ivy Glioblastoma Atlas Project showing high expression of CSTA, SIGLEC9, LILRB3, and MS4A6A in glioblastoma microenvironmental niches, including CT-HBV, CT-MVP, CT-PAN, and CT-PNZ.
Figure 8
Figure 8
Drug Sensitivity Analysis in High-Risk and Low-Risk Groups. Comparison of IC50 values between high-risk and low-risk groups, showing distinct drug sensitivities.

References

    1. Bent M.J.v.D., Geurts M., French P.J., Smits M., Capper D., Bromberg J.E.C., Chang S.M. Primary brain tumours in adults. Lancet. 2023;402:1564–1579. doi: 10.1016/S0140-6736(23)01054-1. - DOI - PubMed
    1. Stupp R., Mason W.P., van den Bent M.J., Weller M., Fisher B., Taphoorn M.J.B., Belanger K., Brandes A.A., Marosi C., Bogdahn U., et al. Radiotherapy plus concomitant and adjuvant temozolomide for glioblastoma. N. Engl. J. Med. 2005;352:987–996. doi: 10.1056/NEJMoa043330. - DOI - PubMed
    1. Perry J.R., Laperriere N., O’Callaghan C.J., Brandes A.A., Menten J., Phillips C., Fay M., Nishikawa R., Cairncross G., Roa W., et al. Short-Course Radiation plus Temozolomide in Elderly Patients with Glioblastoma. N. Engl. J. Med. 2017;376:1027–1037. doi: 10.1056/NEJMoa1611977. - DOI - PubMed
    1. Junfei Z., Andrew X.C., Robyn D.G., Andrew M.S., Luis A., Tim C., Darius B., David S., Jorge S., Aayushi M., et al. Immune and genomic correlates of response to anti-PD-1 immunotherapy in glioblastoma. Nat. Med. 2019;25:462–469. doi: 10.1038/s41591-019-0349-y. - DOI - PMC - PubMed
    1. Khan F., Pang L., Dunterman M., Lesniak M.S., Heimberger A.B., Chen P. Macrophages and microglia in glioblastoma: Heterogeneity, plasticity, and therapy. J. Clin. Investig. 2023;133:e163446. doi: 10.1172/JCI163446. - DOI - PMC - PubMed

LinkOut - more resources