. 2025 May 31;17(11):1852.
doi: 10.3390/cancers17111852.

Development of a Novel Biomarker Platform for Profiling Key Protein-Protein Interactions to Predict the Efficacy of BH3-Mimetic Drugs

Affiliations

Development of a Novel Biomarker Platform for Profiling Key Protein-Protein Interactions to Predict the Efficacy of BH3-Mimetic Drugs

Andrew J Kinloch et al. Cancers (Basel). .

Abstract

One of the hallmarks of cancer cells is their failure to respond to the cellular mechanism of apoptosis. The B-cell lymphoma 2 (BCL-2) family of proteins regulate apoptosis. Their ability to do so can be measured using several methods that in turn anticipate the fate of the cancer cell in response to apoptosis-inducing treatment. These assays ultimately identify the readiness of the cancer cell to undergo apoptosis, which is referred to as the mitochondrial priming state. These metrics, however, have been challenging to implement in the clinic. Methods: Here, we describe a unique method that relies on a panel of novel conformation-specific antibodies (termed PRIMAB) that can directly measure the mitochondrial priming state. These reagents are highly specific for complexes of their corresponding pro-survival protein interactions with the pro-apoptotic protein BIM. These BIM-containing heterodimeric complexes have long been established as hallmarks of primed cancer cells. Results: Using clinically amenable assay formats, PRIMABs were shown to detect the presence of these anti-apoptotic-pro-apoptotic complexes and their disruption by BH3-mimetic drugs. Moreover, PRIMABs were able to detect a shift in priming status following BH3-mimetic treatment, a factor associated with resistance to these drugs. In a panel of AML patient samples, we report a wide range of priming levels for each PRIMAB complex, demonstrating the potential for heterogeneity in responses. We also show that PRIMABs could be predictive of outcomes for AML patients following cytarabine-based treatment. Conclusions: PRIMABs provide novel and useful tools for cancer research and for clinical implementation as reagents providing predictive tests for treatment response.

Keywords: AML; BH3 domain; BH3 mimetics; PRIMAB; apoptosis; flow cytometry; mitochondrial priming.


Conflict of interest statement

A.J.K. is an employee of Ampersand Biomedicines. F.R. and M.S. are employees of Eutropics. B.L. receives research funding from Beigene for BCL2 inhibitor study. J.A.W. has a grant from the Department of Defense Neurofibromatosis Research Program (NFRP) with iNFixion Bioscience. K.R.K. is a consultant at Amgen, AstraZeneca, Denovo Biopharma, Sanofi-Aventis, Takeda, and Verastem; owns stock or other ownership at Agios and Berkeley Lights; and received speakers’ bureau participation for Bayer, Celgene, Epizyme, Janssen, Karyopharm, Lilly, Novartis, and Pharmacyclics. M.H.C. is an employee of and owns stock in Eutropics. All other authors have no conflicts.

Figures

Figure 1
Figure 1
PRIMAB production. (A) Supernatants collected from hybridomas from mice immunized with BCL-XL:BIM, BCL-2:BIM, or MCL-1:BIM covalent complexes were screened for selective binding to non-covalent immunogen complexes. ELISA readouts showing selective binding of mAb raised against the BCL-2:BIM covalent complex. Of 950 clones screened, 14 were highly selective; shown here is clone 2H3 that is a Heterodimer specific BCL-2: BIM (HSB2B). HSB2B not interact with BCL-2 or BIM protein alone but does bind to the BCL-2:BIM complex in a concentration-dependent manner. (B) The selective BCL-2 BH3-mimetic ABT199 (Venetoclax) was used to disrupt the BCL2:BIM complex. The PRIMAB signal aligned with Venetoclax treatment in a dose-dependent manner as determined by ELISA. (C) Supernatant from Hybridoma clone D32 raised against the BCL-XL:BIM complex was applied to the GST-BCL-XL:BIM complex and negative controls as indicated. The HSBXB D32 clone does not bind BCL-XL alone or to the other anti-apoptotic protein:BIM complexes. (D) The HSBXB clone was treated with the BCL2 selective BH3-mimetic Venetoclax or with the BCL-XL selective BH3-mimetic A1155463 at the indicated concentrations for 1 h. As indicated by ELISA, the HSBXB is not displaced by Venetoclax but is displaced by A1155463. (E) ELISA readouts showing selective binding of mAbs raised against the MCL-1:BIM complex. The HSMCB interacts with the MCL-1:BIM complex but neither protein alone. (F) To explore possible crossover binding of the various PRIMABs, biotinylated BIM BH3-domain containing peptides complexed with GST-MCL-1, GST-BCL-2, and GST-BCL-XL were incubated with each PRIMAB. Zero cross reactivity between any one of the PRIMABs and complexes used to make the others was observed.
Figure 2
Figure 2
Various BCL-2 PPI disruptions by BH3-mimetics are detected in cells using PRIMBS. (A) Cell lines shown to have high levels MCL-1:BIM, BCL-2:BIM, or BCL-XL:BIM complexes were treated with the BH3-mimetics AZD5591, ABT-199, or A115463 respectively. Following treatments cells, were prepared and assessed by flow cytometry for complex signal. Error bars are the standard deviation (SD) for 3 wells. (B) Displacement of BIM from BCL-XL is detected by the HXBXB clone D32 in the megakaryoblast cell line SET-2 following treatment with A115463. This disruption of the BCL-XL:BIM complex is accompanied by a compensatory increase in the MCL-1:BIM complex as detected by the HSMCB PRIMAB. (C) The IC50s of cell lines U2932, H929, and U266B1 were determined for each of the BH3-mimetics ABT-199, AZD5591, and A1155463, respectively. PRIMAB readings were made at baseline and following 1 h of treatment at the determined IC50 doses. Baseline readings were set at 1 and the post treatment % fold change in the BCL-2:BIM complex measurements was plotted against the IC50. R2 values: 0.4, 0.87, 0.74, for HSB2B, HSMCB, HSBXB, respectively, indicate strong dependence of BH3-mimetic sensitivity on priming.
Figure 3
Figure 3
BH3-mimetic shifting of priming complexes in cells can be visualized with PRIMABs. (A) Cell blocks were made from ABT-199, A1155463, and AZD5591 treated and untreated U2932, U266B1, and H929 cells to generate TMA slides PRIMABs were used to stain cells as indicated. IHC imaging was performed. Scale bar: 0.020 mm. (B) Pixel intensity of IHC in (A) was quantified using ImageQuant 800. (C) Immunofluorescence imaging of HCC1937 breast cancer cells treated with the BCL-XL BH3-mimetic A1331852 was performed using HSBXB and BCL-XL antibody to measure the BCL-XL:BIM complex and BCL-XL protein alone, respectively. Magnification: 63×. BCL-XL signal (red) colocalizes with HSBXB (green) as indicated in the shift of the green to yellow in untreated cells.
Figure 4
Figure 4
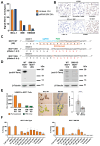
BIM KD/KO impacts PRIMAB staining and priming. (A) HCC1937 breast cancer cells were treated with siRNA targeting BIM. Following treatment, intracellular staining of the MCL-1:BIM complex and total MCL-1, including the unbound MCL-1, was performed. Flow cytometry analysis of the cell line samples are reported as MFI. Following treatment, MCL-1 levels remained consistent with levels in untreated cells, while the level of MCL-1:BIM complex was reduced. The level of reduction on the complex coincided with the KD of BIM protein. (B) HCC1937 breast cancer cells were treated with BCL-XL targeting siRNA or BCL-XL selective BH3-mimetic A-1331852 and prepared into cell blocks arrayed into TMAs following treatment. IHC was performed and images collected provide a visual assessment of the loss of the BCL-XL:BIM complex measured by HSBXB in the siRNA treated cells at a similar level as the A-1331852 treated cells. In addition, MEF-WT and MEF-BIM -/- cells were made into cell blocks and arrayed onto TMAs. The BSBXB-PRIMAB signal and the BCL-XL signals were reduced in the MEF-BIM -/- cells. (C) CRISPR/Cas9 was used to target exon 5 of Bim in a tetraploid human breast cancer cell line (MCF7). The MCF7 2E9 BIM knockout cell line has a two base pair deletion (c.451-452 delGA) in two alleles and a 1 bp insertion (c.452_453 insG) in the other two alleles as confirmed by NGS sequencing. Position of the guide RNA is shown in blue, PAM site in green, and the BH3 domain indicated in orange. (D) Western blot analysis showing absence of BIM in MCF7 2E9 compared to otherwise isogenic wild-type MCF7 line (1C5). (E) MCF7-WT and MCF7-BIM KO were stained with HSMCB. The flow readout (MFI) indicated a significant loss of signal in the permeabilized BIM KO cells compared to the permeabilized WT cells. The signal in non-permeabilized cells indicated nonspecific background staining. The MCF7-WT and MCF7-BIM KO cells were made into cell blocks and used to generate TMAs. IHC images on samples stained with HSMCB. Images of cytoplasmic segmented staining were analyzed using HALO. Student’s two-tailed t-test was used for analysis. Magnification: 20×. (F) BH3 profiling was performed on MCF7-WT and MCF7-BIM KO permeabilized and treated with BH3-mimetic peptides and controls as indicated.
Figure 5
Figure 5
PRIMABs detect CDK9 inhibitor impacting MCL-1:BIM PPIs. (A) CDK9 inhibitor VIP152 (Enitociclib) was used to treat H929 cells, and both MCL-1 protein and MCL-1:BIM complex levels were measured by flow cytometry. (B) HSMCB signal measured in 5A shifts up in a dose- and time-dependent manner relative to total MCL-1. (C) PRIMAB measurements of BCL-2:BIM, BCL-XL:BIM and MCL-1:BIM complexes in human leukemia cell lines KG1a, MV411, HAL929.1.7, EOL-1, SKM-1, F39-P. Molm-13, and NB4 were obtained using Flow cytometry. These measurements were compared to the Broad Institute Cancer Cell Encyclopedia-reported IC50s of EGFR inhibitors Osimertinib, Cetuximab, and Dacomitinib for each cell line. HSMCB PRIMAB clones, F05 and B06 respectively, aligned with the reported cell lines IC50s for Osimertinib (R2 = 0.71, R2 = 0.69) and clone F05 with Cetuximab (R2 = 0.067), while the PRIMAB readout of HSB2B aligned with the cell lines IC50s for Dacomitinib (R2 = 0.067).
Scheme 1
Scheme 1
PRIMABs recognized conformational epitopes on intracellular BCL-2 PPIs. Intracellular staining with PRIMABs on Ficoll-purified patient biopsies. Flow cytometry readouts are assessed for correlation to patient response to treatment. Schematic made using BioRender.
Figure 6
Figure 6
PRIMAB technical performance and signal range in AML patient samples. (A) Inter-operator precision for two runs performed by operator 1 (RA) on day 1 and day 2. Data were collected on a panel of human leukemia cell lines (H929, U266B1, U2932, THP1, ML2, KG1a, MV411, HAL929.1.7, EOL-1, SKM-1, F-36P (CVCL_2037), MOLM-13, NB4, and RS4-1). (B) Intraoperation accuracy runs were performed by two operators. All assays passed precision (R2 > 0.5). (C) AML patient samples were fixed, permeabilized, and stained with PRIMABs, then analyzed by flow cytometry to determine the population of complexes present in each patient sample.
Figure 7
Figure 7
Correlation of PRIMAB signals to AML patient response to treatment. (A) Archival AML Patient bone marrow and peripheral blood samples were analyzed with the PRIMABs or with antibodies to the constituent anti-apoptotic proteins and BIM. Testing was performed on ficoll purified peripheral blood biopsies collected immediately prior to treatment with cytarabine based therapy (7+3). These were fixed, permeabilized, and stained with antibodies to BCL-2, BCL-XL, BIM, and MCL-1 and PRIMABs HSB2B, HSMCB, or HSBXB prior to analysis by flow cytometry. Readouts were compared to the event free survival in patients (EFS). Neither the anti-apoptotic proteins nor BIM expression measurements showed significant correlation to EFS. Significant correlation was seen with both the HSB2B PRIMAB (p = 0.026) and HSMCB PRIMAB (p = 0.037). The HSBXB signal did not correlate to response. (See Supplemental Figure S6). (B) BH3 profiling was also performed on the same patient samples. BIM priming did not significantly correlate to EFS (p = 0.107), nor did the MS-1 peptide JC1 signal induced by the MS-1 peptide (p = 0.958). Student’s two-tailed t-test was used for statistical analysis.
Figure 8
Figure 8
PRIMABs priming measurements in fixed solid tumor samples. (A) PRIMABs were used to detect the priming state of small cell lung cancer patient tumor biopsies prepared as FFPE. False color reflects intensity of staining (mean cytoplasmic OD); yellow = low; orange = medium; red = high. (B) TMA analysis of triple positive breast cancer patient samples was stained with PRIMABs, and quantification was performed using HALO imaging software. Red numbers within respective bars indicate the number of cells analyzed. The significance of the PRIMAB signals over background is extremely high (p < 0.0001). Data indicates that PRIMABs can identify the BCL-2:BIM, BCL-XL:BM, and MCL-1:BIM complexes in both (A) small cell lung cancer and (B) triple positive breast lung cancer FFPE samples and that they are suitable for use in patient tissue. (C) In xenograft mouse models of breast cancer cell lines SUM-149 or MDA MB-231 we show that the MCL-1 inhibitor AZD5991 treatment induced tumor regression in an MCL-1-primed (SUM-149) but not an unprimed (MDA-MB-231) line. MCL-1:BIM priming is detected by HSMCB. Bar chart represents mean cytoplasmic OD for 5 fields of view for the respective stained tissues. The PRIMAB signal to response correlation is highly significant (p < 0.0005). Magnification: 10×.

References

    1. Harrington S.E., Smith T.J. The Role of Chemotherapy at the End of Life: “When Is Enough, Enough?”. JAMA. 2008;299:2667–2678. doi: 10.1001/jama.299.22.2667. - DOI - PMC - PubMed
    1. Passaro A., Al Bakir M., Hamilton E.G., Diehn M., André F., Roy-Chowdhuri S., Mountzios G., Wistuba I.I., Swanton C., Peters S. Cancer Biomarkers: Emerging Trends and Clinical Implications for Personalized Treatment. Cell. 2024;187:1617–1635. doi: 10.1016/j.cell.2024.02.041. - DOI - PMC - PubMed
    1. Simon R. Genomic Biomarkers in Predictive Medicine. An Interim Analysis. EMBO Mol. Med. 2011;3:429–435. doi: 10.1002/emmm.201100153. - DOI - PMC - PubMed
    1. Manjang K., Yli-Harja O., Dehmer M., Emmert-Streib F. Limitations of Explainability for Established Prognostic Biomarkers of Prostate Cancer. Front. Genet. 2021;12:649429. doi: 10.3389/fgene.2021.649429. - DOI - PMC - PubMed
    1. Letai A., Bhola P., Welm A.L. Functional Precision Oncology: Testing Tumors with Drugs to Identify Vulnerabilities and Novel Combinations. Cancer Cell. 2022;40:26–35. doi: 10.1016/j.ccell.2021.12.004. - DOI - PMC - PubMed

LinkOut - more resources