

The Effect of Thermal-Softened Endotracheal Tubes on Postoperative Sore Throat and Other Complications-A Systematic Review and Meta-Analysis
- PMID: 40507382
- PMCID: PMC12155181
- DOI: 10.3390/jcm14113620
The Effect of Thermal-Softened Endotracheal Tubes on Postoperative Sore Throat and Other Complications-A Systematic Review and Meta-Analysis
Abstract
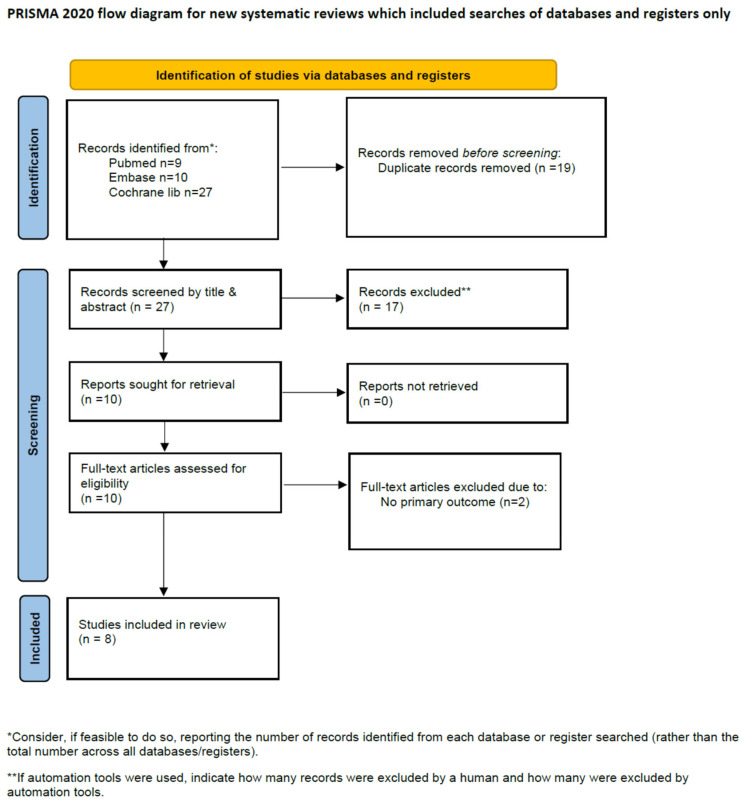
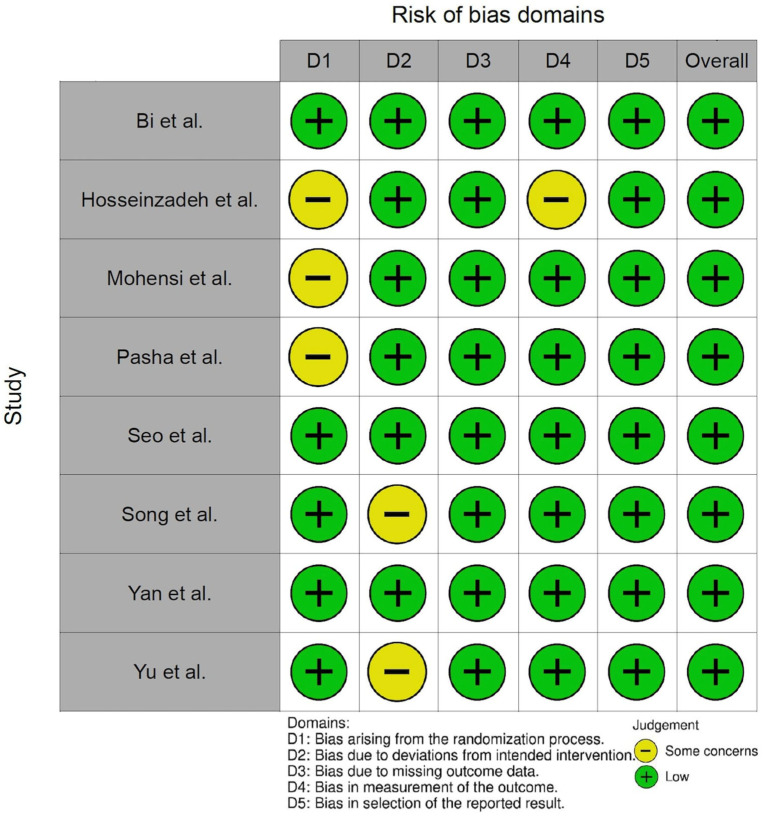
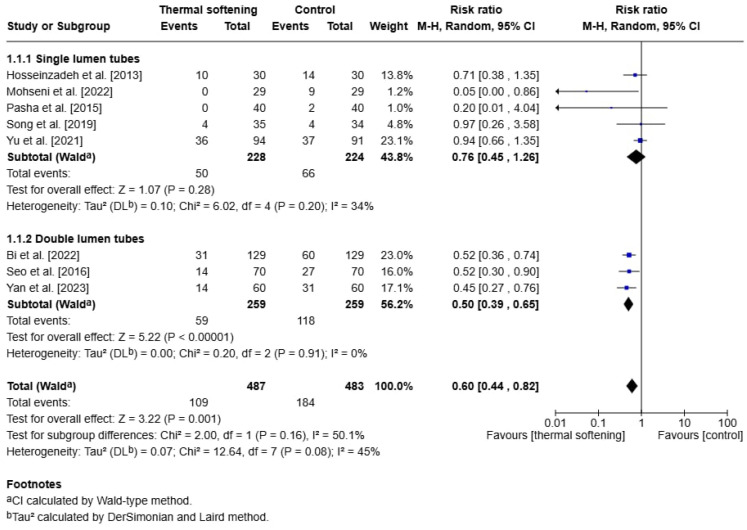
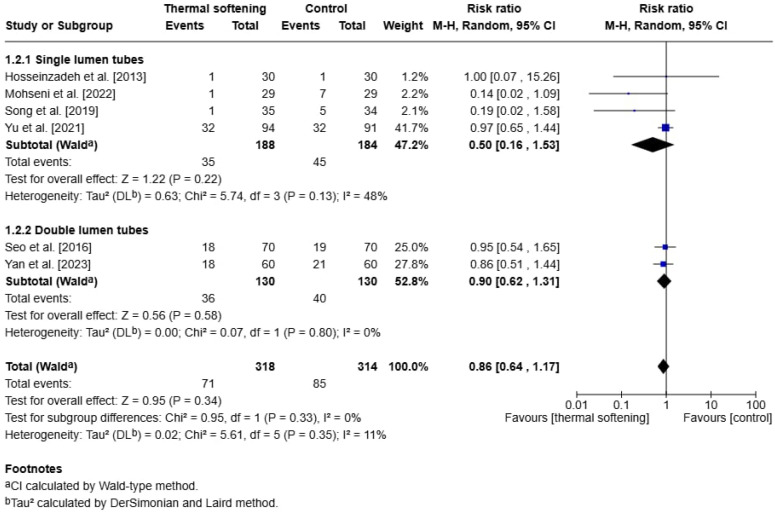
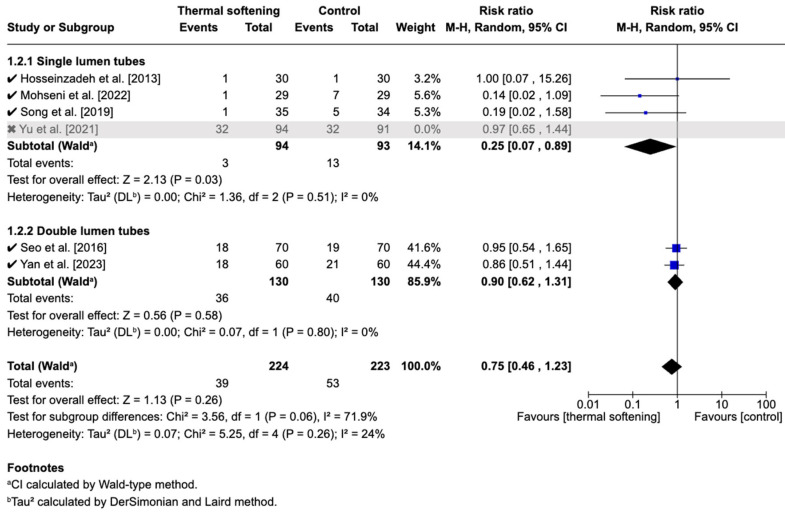
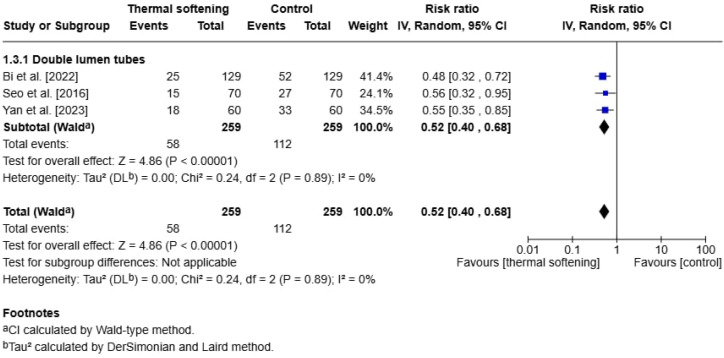
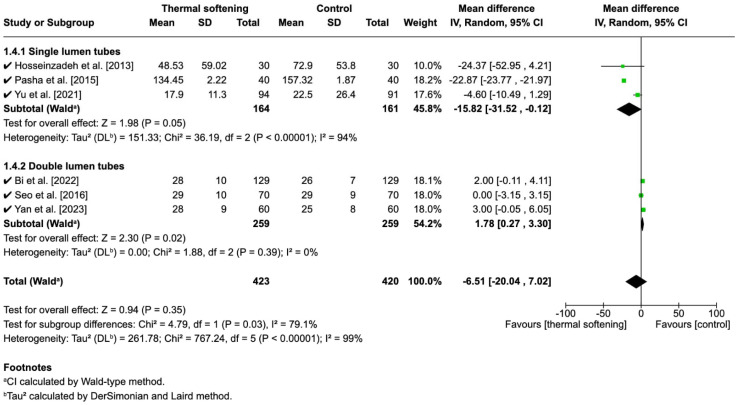
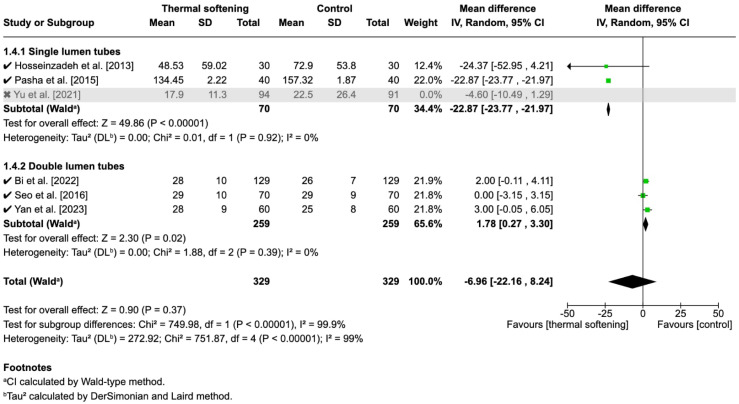
Background: Endotracheal tube (ETT) intubation during general anesthesia (GA) is commonly associated with postoperative sore throat. This study aimed to evaluate whether thermal-softened ETTs reduce the postoperative sore throat incidence in patients undergoing elective surgery under GA. Methods: We conducted a comprehensive search of the literature across PubMed, Cochrane Library, and EMBASE to identify randomized controlled trials (RCTs) evaluating the effect of thermal-softened ETTs on postoperative sore throat in patients undergoing elective surgeries under GA. The primary outcome was postoperative sore throat incidence, while secondary outcomes included hoarseness, vocal cord lesions, and time to intubation. Data were extracted independently by two authors, and the risk of bias was assessed using the Revised Cochrane risk of bias tool (version 2.0). A meta-analysis was then performed using the random-effects model, with the results expressed as risk ratios (RRs) and mean difference (MDs). Results: Eight studies, with a total of 970 participants, were included. Thermal-softened ETTs significantly reduced postoperative sore throat incidence (RR: 0.60, 95% CI: 0.44 to 0.82, p = 0.001). Subgroup analysis showed no difference for single-lumen tubes (RR: 0.76, 95% CI: 0.45 to 1.26, p = 0.28), but remained significant for double-lumen tubes (RR: 0.5, 95% CI: 0.39 to 0.65, p < 0.00001). No significant difference was found in hoarseness (RR: 0.86, 95% CI: 0.64 to 1.17, p = 0.34), but a lower incidence of vocal cord lesions (RR: 0.52, 95% CI: 0.40 to 0.68, p < 0.00001) was observed. No difference was found in the time to intubation (MD: -6.51, 95% CI: -20.04 to 7.02, p = 0.35). Conclusions: Thermal-softened ETTs may reduce the incidence of postoperative sore throat and vocal cord lesions but have no significant effect on hoarseness or intubation time.
Keywords: equipment design; hoarseness; intratracheal; intubation; laryngeal diseases; pharyngitis; postoperative complications.
Conflict of interest statement
The authors declare no conflicts of interest.
Figures
Similar articles
-
The effects of thermal softening of double-lumen endobronchial tubes on postoperative sore throat, hoarseness and vocal cord injuries: a prospective double-blind randomized trial.Br J Anaesth. 2016 Feb;116(2):282-8. doi: 10.1093/bja/aev414. Br J Anaesth. 2016. PMID: 26787799 Clinical Trial.
-
Effects of thermal softening of endotracheal tubes on postoperative sore throat: A randomized double-blinded trial.Acta Anaesthesiol Scand. 2021 Feb;65(2):213-219. doi: 10.1111/aas.13705. Epub 2020 Sep 23. Acta Anaesthesiol Scand. 2021. PMID: 32926423 Clinical Trial.
-
Effects of Thermal Softening of Double-Lumen Endobronchial Tubes on the Prevention of Postoperative Sore Throat in Smokers: A Randomized Controlled Trial.J Cardiothorac Vasc Anesth. 2022 Aug;36(8 Pt B):3109-3113. doi: 10.1053/j.jvca.2022.04.017. Epub 2022 Apr 15. J Cardiothorac Vasc Anesth. 2022. PMID: 35537970 Clinical Trial.
-
Effectiveness of preoperative ketamine gargle to reduce postoperative sore throat in adult patients undergoing surgery with endotracheal tube; systematic review and meta-analysis of randomized control trials.BMC Anesthesiol. 2024 Dec 6;24(1):449. doi: 10.1186/s12871-024-02837-7. BMC Anesthesiol. 2024. PMID: 39643910 Free PMC article.
-
Topical application of licorice for prevention of postoperative sore throat in adults: A systematic review and meta-analysis.J Clin Anesth. 2019 May;54:25-32. doi: 10.1016/j.jclinane.2018.10.025. Epub 2018 Nov 2. J Clin Anesth. 2019. PMID: 30391446
References
-
- Chinachoti T., Pojai S., Sooksri N., Rungjindamai C. Risk factors of post-operative sore throat and hoarseness. J. Med. Assoc. Thai. 2017;100:463–468. - PubMed
Publication types
LinkOut - more resources
Full Text Sources
Research Materials
Miscellaneous
