. 2025 May 22;26(11):4996.
doi: 10.3390/ijms26114996.

Mechanistic Insights into Anti-Nectin4-VcMMAE-Induced Ocular Toxicity: From Cellular Uptake Pathways to Molecular Modification

Affiliations

Mechanistic Insights into Anti-Nectin4-VcMMAE-Induced Ocular Toxicity: From Cellular Uptake Pathways to Molecular Modification

Jialing Zhang et al. Int J Mol Sci. .

Abstract

Antibody-drug conjugates (ADCs) represent a novel approach to cancer treatment. Enfortumab vedotin (PADCEV), as a prominent example, has demonstrated remarkable clinical efficacy. However, its ocular toxicity has raised concerns. This study aimed to explore the molecular mechanisms underlying PADCEV-induced ocular toxicity. SD rats, whose ocular structures are similar to those of humans, were selected to establish an ocular toxicity model to mimic the human response. In vitro experiments were conducted using human primary corneal epithelial cells, HCE-T. The results confirmed that nectin-4 plays a crucial role in the cellular uptake of PADCEV, and non-specific pinocytosis is also involved. Additionally, a variant was obtained by introducing point mutations in the Fc region of PADCEV, which was found to reduce corneal epithelial toxicity. The findings of this study not only deepen our understanding of ADC-induced ocular toxicity but also provide new insights into optimizing ADC design and enhancing treatment safety.

Keywords: endocytosis mechanism; enfortumab vedotin; molecular optimization; ocular toxicity.


Conflict of interest statement

The authors declare no conflicts of interest.

Figures

Figure 1
Figure 1
Establishing the anti-Nectin4-VcMMAE-induced ocular toxicity rat model. (A) Animal groups and drug administration. Rats were divided into two groups of 5. The drug was administered once a week for 4 weeks. (B) Representative figures showing sodium fluorescein staining of rat eyes. The right panel shows increased staining in the anti-Nectin4-VcMMAE group compared with staining in the control group. The area indicated by the red arrow in the figure represents the stained area, where green fluorescent signals can be observed. Scale bar = 1 mm. (C) Representative figure of ocular histopathological sections. The right panel shows increased corneal epithelial damage and cell necrosis in the anti-Nectin4-VcMMAE group compared with the control group. The area indicated by the black arrow in the figure is the part of the cornea with obvious damage. Scale bar = 200 μm.
Figure 2
Figure 2
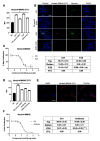
Cytotoxicity and receptor expression in HCE-T cells. (A) Western blot detection of Nectin-4 expression in the three cell types. ACTB (beta-actin) was used as a control (left). Flow cytometry detection of Nectin-4 expression in HCE-T cells. Control groups were unstained (right). (B) HCE-T cells were seeded into 96-well plates and incubated with gradient dilutions of MMAE and anti-Nectin4-VcMMAE for 4 days. After the addition of CCK-8, absorbance was measured at 450 nm (left). Several parameters were calculated, including upper plateau, lower plateau, IC50, and determination coefficient. Data are presented as the mean ± SEM (n = 3). (C) HCE-T cells were seeded into 96-well plates and treated with gradient dilutions of EIPA for 3.5 h (black bars) and 24 h (gray bars). After the addition of CCK-8, absorbance was measured at 450 nm. Data are presented as the mean ± SEM (n = 3). Except for the last four groups of data, there were significant differences between any two groups of data obtained at the same time point, with ns = non-significant (p > 0.05). (D) HCE-T cells were seeded into 6-well plates and treated with different concentrations of EIPA for 30 min at 37 °C, followed by the addition of 1 mg/mL Dextran-Alexa Fluor™ 488 for another 3 h. Cells were incubated at 4 °C for the Mock group. Intracellular fluorescence intensity was detected by flow cytometry. Data are presented as the mean ± SEM (n = 3), * p < 0.05, ** p < 0.01. (E) HCE-T cells were seeded into 6-well plates and treated with EIPA, FcB, or a combination of EIPA and FcB for 30 min, followed by the addition of 1 mg/mL Dextran-Alexa Fluor™ 488 for another 3 h. Intracellular fluorescence intensity was detected by flow cytometry. Data are presented as the mean ± SEM (n = 3), ** p < 0.01, ns = non-significant (p > 0.05). (F) Western blot detection of CD32 expression in the three cell types. ACTB was used as a control.
Figure 3
Figure 3
Cellular entry pathways for anti-Nectin4-VcMMAE. (A) HCE-T cells were seeded into 6-well plates and treated with EIPA, FcB, or a combination of EIPA and FcB for 30 min, followed by the addition of 40 μM anti-Nectin4-VcMMAE-CY3 for 3 h. Intracellular fluorescence was detected by flow cytometry. Data are presented as the mean ± SEM (n = 3). There were significant differences between any two groups of data, with ** p < 0.01. (B) HCE-T cells were seeded into the glass-bottom dishes and observed by fluorescence microscopy. Blue represents DAPI, red represents ADC inside cells, and green represents dextran. Scale bar = 50 μm. (C) HCE-T cells were seeded into 96-well plates. Cells in the treatment group were incubated with FcB for 30 min, followed by treatment with the indicated dilutions of anti-Nectin4-VcMMAE for 4 days. After the addition of CCK-8, absorbance was measured at 450 nm to detect surviving cells (left panel). Data are presented as the mean ± SEM (n = 3), ns = non-significant (p > 0.05). (D) HCE-T cells were treated with EIPA and 40 nM naked antibody for 30 min. After washing away the unbound antibody with PBS, anti-Nectin4-VcMMAE-CY3 was added to the cells. Flow cytometry was used to detect the endocytosis of ADC. Data are presented as the mean ± SEM (n = 4). There were significant differences between any two groups of data, with ** p < 0.01. (E) HCE-T cells were seeded into glass-bottom dishes and observed by fluorescence microscopy. Blue represents DAPI and red represents ADC in cells. Scale bar = 50 μm. (F) HCE-T cells were seeded into 96-well plates. Cells in the treatment group were incubated with naked antibody for 30 min, followed by the addition of gradient dilutions of anti-Nectin4-VcMMAE for 4 days. After the addition of CCK-8, absorbance was measured at 450 nm to detect surviving cells (left panel). Data are presented as the mean ± SEM (n = 3), ** p < 0.01.
Figure 4
Figure 4
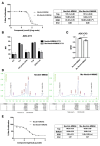
Molecular modification to reduce ocular toxicity. (A) HCE-T cells were seeded into 96-well plates and treated with gradient dilutions of anti-Nectin4-VcMMAE or Mu-anti-Nectin4-VcMMAE for 4 days. After the addition of CCK-8, absorbance was measured at 450 nm to detect surviving cells (left panel). Data are presented as the mean ± SEM (n = 3), ** p < 0.01. (B) HCE-T cells were treated with EIPA and FcB for 30 min, followed by the addition of either anti-Nectin4-VcMMAE-CY3 or mu-anti-Nectin4-VcMMAE-CY3. Flow cytometry was used to detect the endocytosis of ADC. Data are presented as the mean ± SEM (n = 3). (C) A statistical analysis of the results in Figure 4B comparing the endocytosis of anti-Nectin4-VcMMAE-CY3 vs. mu-anti-Nectin4-VcMMAE-CY3. Data are presented as the mean ± SEM (n = 3), * p < 0.05. (D) The charge heterogeneity of anti-Nectin4-VcMMAE (left) and mu-anti-Nectin4-VcMMAE (right) detected by iCIEF. The table shows the proportion of the area corresponding to each peak. The x-axis labeled “pI” stands for “isoelectric point”. It is the pH value at which a molecule has a net charge of zero. Each peak corresponds to a specific charge-state species with its own pI value, and the table shows the proportion of the area of each peak, which reflects the relative abundance of each charge-state species. (E) PC3-AGS22 cells were seeded into 96-well plates and treated with gradient dilutions of anti-Nectin4-VcMMAE or mu-anti-Nectin4-VcMMAE for 4 days. After the addition of CCK-8, absorbance was measured at 450 nm to detect surviving cells (left panel). Data are presented as the mean ± SEM (n = 3), ns = non-significant (p > 0.05).

Similar articles

References

    1. Moolten F.L., Capparell N.J., Cooperband S.R. Antitumor effects of antibody-diphtheria toxin conjugates: Use of hapten-coated tumor cells as an antigenic target. J. Natl. Cancer Inst. 1972;49:1057–1062. - PubMed
    1. Beck A., Reichert J.M. Antibody-Drug Conjugates. Proc. Natl. Acad. Sci. USA. 2013;6:15–17. doi: 10.4161/mabs.27436. - DOI
    1. Jaffry M., Choudhry H., Aftab O.M., Dastjerdi M.H. Antibody-Drug Conjugates and Ocular Toxicity. J. Ocul. Pharmacol. Ther. 2023;39:675–691. doi: 10.1089/jop.2023.0069. - DOI - PubMed
    1. Carter P.J., Senter P.D. Antibody-drug conjugates in cancer therapy. Annu. Rev. Med. 2013;64:15–29. doi: 10.1097/PPO.0b013e318172d704. - DOI - PubMed
    1. Li C., Wang J., Wang Y., Gao H., Wei G., Huang Y., Yu H., Gan Y., Wang Y., Mei L. Recent progress in drug delivery. Acta Pharm. Sin. B. 2019;9:1145–1162. doi: 10.1016/j.apsb.2019.08.003. - DOI - PMC - PubMed

LinkOut - more resources