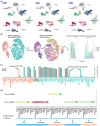
scDown: A Pipeline for Single-Cell RNA-Seq Downstream Analysis
- PMID: 40508102
- PMCID: PMC12154318
- DOI: 10.3390/ijms26115297
scDown: A Pipeline for Single-Cell RNA-Seq Downstream Analysis
Abstract
Single-cell transcriptomics data are analyzed using two popular tools, Seurat and Scanpy. Multiple separate tools are used downstream of Seurat and Scanpy cell annotation to study cell differentiation and communication, including cell proportion difference analysis between conditions, pseudotime and trajectory analyses to study cell transition, and cell-cell communication analysis. To automate the integrative cell differentiation and communication analyses of single-cell RNA-seq data, we developed a single-cell RNA-seq downstream analysis pipeline called "scDown". This R package includes cell proportion difference analysis, cell-cell communication analysis, pseudotime analysis, and RNA velocity analysis. Both Seurat and Scanpy annotated single-cell RNA-seq data are accepted in this pipeline. We applied scDown to a published dataset and identified a unique, previously undiscovered signature of neuronal inflammatory signaling associated with a rare genetic neurodevelopmental disorder. These findings were not identified with a simple implementation of Seurat differential gene expression analysis, illustrating the value of our pipeline in biological discovery. scDown can be broadly utilized in downstream analyses of scRNA-seq data, particularly in rare diseases.
Keywords: cell proportion difference analysis; cell–cell communication; pseudotime analysis; single-cell transcriptomics; trajectory analysis.
Conflict of interest statement
The authors declare no conflicts of interest.
Figures


References
-
- Valenzi E., Tabib T., Papazoglou A., Sembrat J., Bittar H.E.T., Rojas M., Lafyatis R. Disparate Interferon Signaling and Shared Aberrant Basaloid Cells in Single-Cell Profiling of Idiopathic Pulmonary Fibrosis and Systemic Sclerosis-Associated Interstitial Lung Disease. Front. Immunol. 2021;12:595811. doi: 10.3389/fimmu.2021.595811. - DOI - PMC - PubMed
-
- Álvarez-Sánchez E., Carbayo Á., Valle-Tamayo N., Muñoz L., Aumatell J., Torres S., Rubio-Guerra S., García-Castro J., Selma-González J., Alcolea D., et al. Single-Cell RNA Sequencing Highlights the Role of Distinct Natural Killer Subsets in Sporadic Amyotrophic Lateral Sclerosis. J. Neuroinflamm. 2025;22:15. doi: 10.1186/s12974-025-03347-0. - DOI - PMC - PubMed
-
- Miller S.A., Policastro R.A., Sriramkumar S., Lai T., Huntington T.D., Ladaika C.A., Kim D., Hao C., Zentner G.E., O’Hagan H.M. LSD1 and Aberrant DNA Methylation Mediate Persistence of Enteroendocrine Progenitors That Support BRAF-Mutant Colorectal Cancer. Cancer Res. 2021;81:3791–3805. doi: 10.1158/0008-5472.CAN-20-3562. - DOI - PMC - PubMed
MeSH terms
LinkOut - more resources
Full Text Sources

